# How do I make a illustration of particles in a tube?
**URL:** https://discourse.paraview.org/t/how-do-i-make-a-illustration-of-particles-in-a-tube/3586
**Category:** ParaView Support
**Created:** [February 18, 2020, 1:47am UTC](https://discourse.paraview.org/t/how-do-i-make-a-illustration-of-particles-in-a-tube/3586 "2020-02-18T01:47:35Z")
**Posts on this page:** 15
**Page:** 1
### Author:  [@Cal](https://discourse.paraview.org/u/Cal)
#### Post date: [February 18, 2020, 1:47am UTC](https://discourse.paraview.org/t/how-do-i-make-a-illustration-of-particles-in-a-tube/3586/1 "2020-02-18T01:47:36Z")
Hi all,
I am currently working on a code in openFOAM which simulates a spray through a cylindrical tube. I have successfully imported the data into paraview but am having trouble creating the types of images and graphs that I want. Attached below are examples of what I am trying to create. The dots represent the spray droplets with UX UY UZ being velocity and d being diameter. I have a multi-block data set.
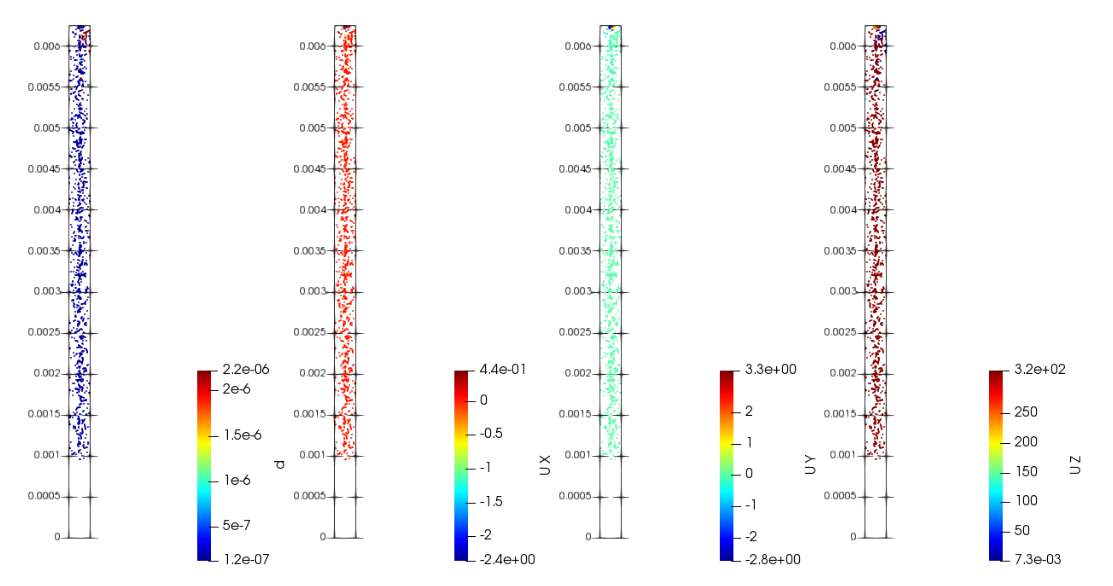
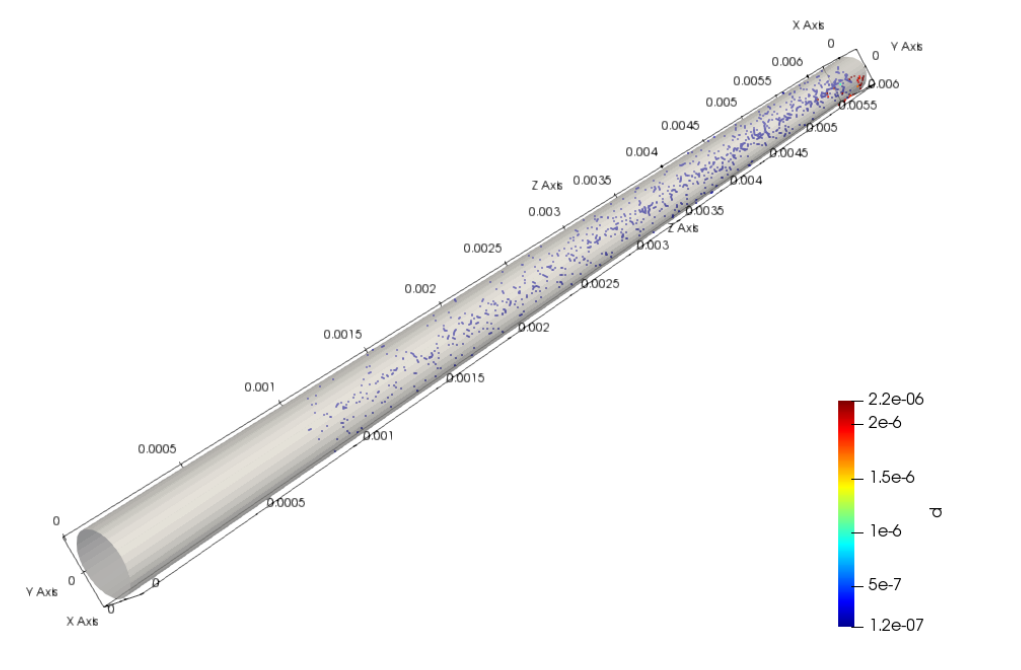
I am using Paraview 5.4.0 64-bit (Legacy Rendering Backend) and am in a position where I cant use any other version. Any guidance or assistance on how I would recreate these images would be greatly appreciated.
Thanks!
Cal
---
### Author:  [@mwestphal](https://discourse.paraview.org/u/mwestphal)
#### Post date: [February 18, 2020, 2:20am UTC](https://discourse.paraview.org/t/how-do-i-make-a-illustration-of-particles-in-a-tube/3586/2 "2020-02-18T02:20:57Z")
Well, what have you been able to generate so far ? Can you share a example of your data ?
---
### Author:  [@randomwangran](https://discourse.paraview.org/u/randomwangran)
#### Post date: [February 18, 2020, 2:36am UTC](https://discourse.paraview.org/t/how-do-i-make-a-illustration-of-particles-in-a-tube/3586/3 "2020-02-18T02:36:10Z")
it’s really nice plot!
---
### Author:  [@Cal](https://discourse.paraview.org/u/Cal)
#### Post date: [February 18, 2020, 2:41am UTC](https://discourse.paraview.org/t/how-do-i-make-a-illustration-of-particles-in-a-tube/3586/4 "2020-02-18T02:41:02Z")
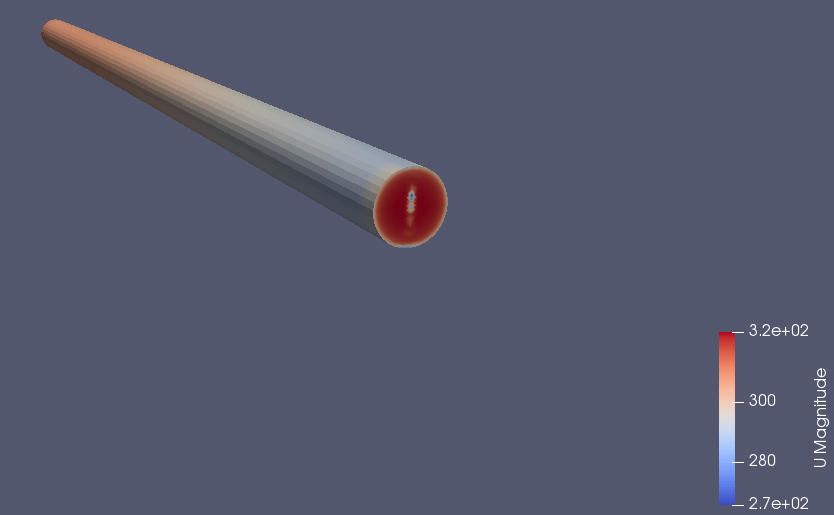
Hey thanks for the reply. Attached below is what I have so far (Render view and spreadsheet view).

---
### Author:  [@randomwangran](https://discourse.paraview.org/u/randomwangran)
#### Post date: [February 18, 2020, 2:49am UTC](https://discourse.paraview.org/t/how-do-i-make-a-illustration-of-particles-in-a-tube/3586/5 "2020-02-18T02:49:34Z")
> [@Cal](#):
>
> openFOAM
Can you please pin point which tutorial you follow in OpenFOAM?
I can have a try.
---
### Author:  [@mwestphal](https://discourse.paraview.org/u/mwestphal)
#### Post date: [February 18, 2020, 2:51am UTC](https://discourse.paraview.org/t/how-do-i-make-a-illustration-of-particles-in-a-tube/3586/6 "2020-02-18T02:51:41Z")
You will have to extract the droplets, perhaps using Threshold or Contour.
---
### Author:  [@Cal](https://discourse.paraview.org/u/Cal)
#### Post date: [February 18, 2020, 2:52am UTC](https://discourse.paraview.org/t/how-do-i-make-a-illustration-of-particles-in-a-tube/3586/7 "2020-02-18T02:52:52Z")
Hi I have received this case from someone else for my thesis and it deviates a lot from the tutorials, but it uses the sprayFoam solver within openFOAM which I believe is the aachenBomb tutorial.
Good luck 🙂
---
### Author:  [@Cal](https://discourse.paraview.org/u/Cal)
#### Post date: [February 18, 2020, 2:53am UTC](https://discourse.paraview.org/t/how-do-i-make-a-illustration-of-particles-in-a-tube/3586/8 "2020-02-18T02:53:29Z")
Thanks for the suggestion, I will try this now 😃
---
### Author:  [@randomwangran](https://discourse.paraview.org/u/randomwangran)
#### Post date: [February 18, 2020, 2:54am UTC](https://discourse.paraview.org/t/how-do-i-make-a-illustration-of-particles-in-a-tube/3586/9 "2020-02-18T02:54:33Z")
> [@Cal](#):
>
> the aachenBomb
> [Commit search results · GitHub](https://github.com/OpenFOAM/OpenFOAM-dev/search?q=aachenBomb&type=Commits)
→ NULL
---
### Author:  [@Cal](https://discourse.paraview.org/u/Cal)
#### Post date: [February 18, 2020, 3:05am UTC](https://discourse.paraview.org/t/how-do-i-make-a-illustration-of-particles-in-a-tube/3586/10 "2020-02-18T03:05:14Z")
> **[OpenFOAM/OpenFOAM-6](https://github.com/OpenFOAM/OpenFOAM-6/tree/master/tutorials/lagrangian/sprayFoam/aachenBomb)**
>
> OpenFOAM Foundation repository for OpenFOAM version 6 - OpenFOAM/OpenFOAM-6
I think this is it
---
### Author:  [@randomwangran](https://discourse.paraview.org/u/randomwangran)
#### Post date: [February 18, 2020, 4:01am UTC](https://discourse.paraview.org/t/how-do-i-make-a-illustration-of-particles-in-a-tube/3586/11 "2020-02-18T04:01:01Z")
I will play with it.
> **[randomwangran/computing](https://github.com/randomwangran/computing/tree/master/classic/caseIdoNotUnderstand/aachenBomb)**
>
> Please let me know what you want to compute. I am interested in everything and I want to compute everything. - randomwangran/computing
Please comment anything if you like.
---
### Author:  [@Cal](https://discourse.paraview.org/u/Cal)
#### Post date: [February 27, 2020, 1:49am UTC](https://discourse.paraview.org/t/how-do-i-make-a-illustration-of-particles-in-a-tube/3586/12 "2020-02-27T01:49:39Z")
Hi all,
Update on this, my issue was that the Lagrangian data was not being displayed. I have solved this by converting the data to VTK format using the foamToVTK conversion with the mpirun command as my code was run on multiple processors. I now have the lagrangian data displayed, but the positions of the data is incorrect. Below you can see that the data is mainly located on the z-y plane when it should be displaying throughout the volume of the cylinder:
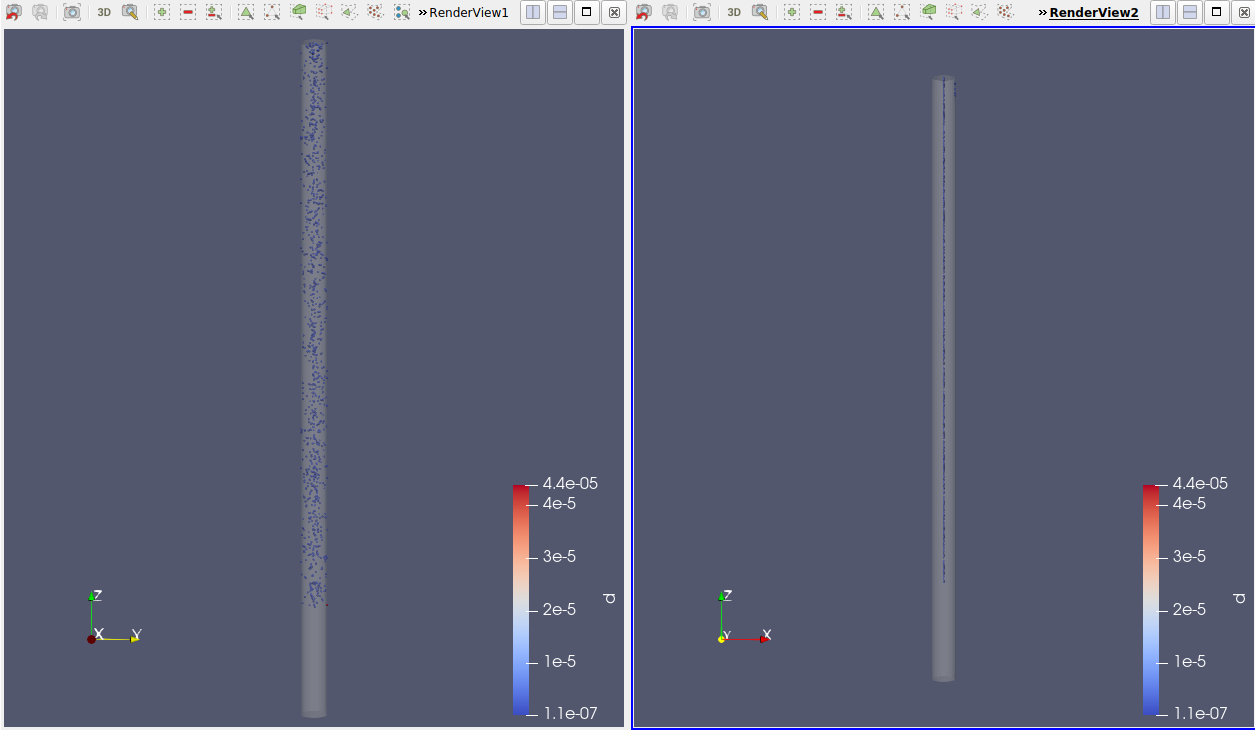
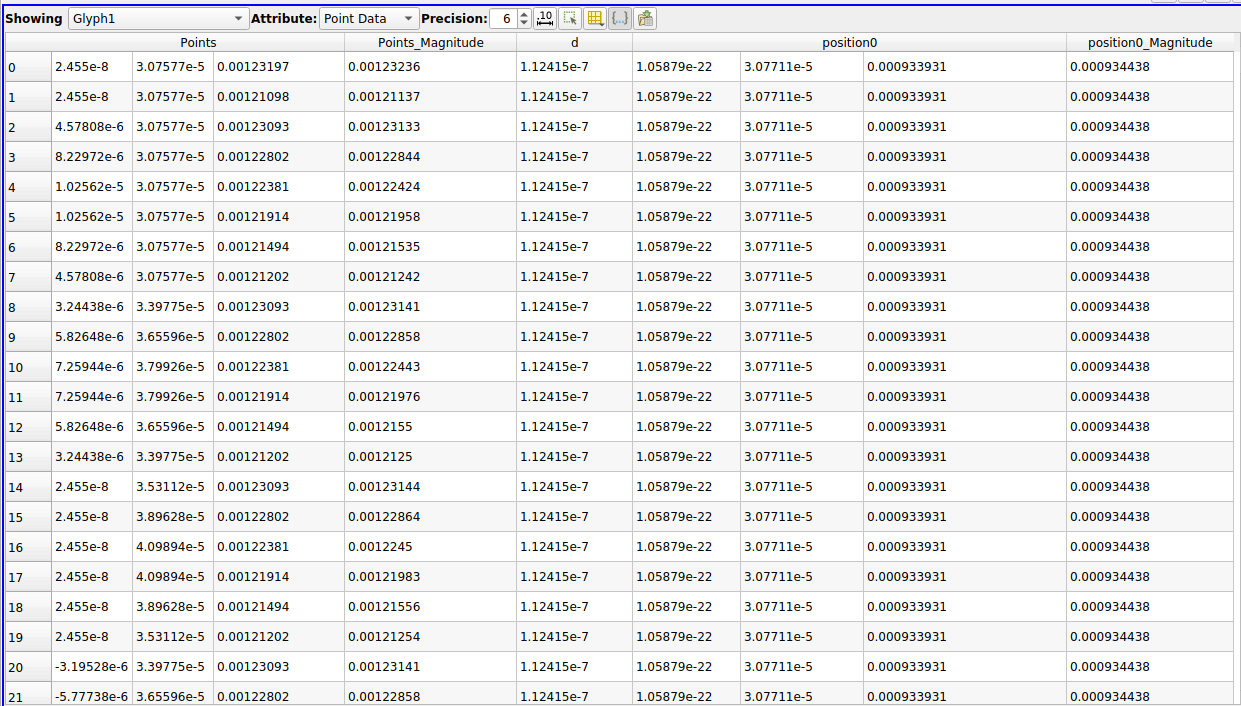
From the spreadsheet view you can see that all of the x-coordinates in the Position0 heading are all really small numbers (1x10^-22) which is why the data is mainly on the z-y pane. However the position coordinates under the points heading are distributed throughout the volume of the cylinder.
I’m not sure why the data is displaying the way it is:
1. could it be an issue with how the data was converted to VTK format?
2. should the position of the lagrangian data be determined by the position0 heading or points heading?
---
### Author:  [@mwestphal](https://discourse.paraview.org/u/mwestphal)
#### Post date: [February 27, 2020, 3:20am UTC](https://discourse.paraview.org/t/how-do-i-make-a-illustration-of-particles-in-a-tube/3586/13 "2020-02-27T03:20:28Z")
> could it be an issue with how the data was converted to VTK format?
Yes, but you will have to ask OpenFOAM about that.
> should the position of the lagrangian data be determined by the position0 heading or points heading?
You can try that easily by using the Calculator filter and the “Results coordinates” checkbox.
---
### Author:  [@Cal](https://discourse.paraview.org/u/Cal)
#### Post date: [February 28, 2020, 1:49am UTC](https://discourse.paraview.org/t/how-do-i-make-a-illustration-of-particles-in-a-tube/3586/14 "2020-02-28T01:49:07Z")
Thanks again for the reply!
I’m currently attempting this but I’ve never used the calculator function before.
I tried this: coordsX_iHat+coordsY_jHat+coordsZ\*kHat
but nothing changed and I cant see any new data in spreadsheet view.
What should I input to have it display the solution using the points vector data instead of position0 vector data?
---
### Author:  [@mwestphal](https://discourse.paraview.org/u/mwestphal)
#### Post date: [February 28, 2020, 2:04am UTC](https://discourse.paraview.org/t/how-do-i-make-a-illustration-of-particles-in-a-tube/3586/15 "2020-02-28T02:04:20Z")
Use `position0` as your calculator function and check the “Result Coordinates” checkbox.