# How to add a reference line in visualization?
**URL:** https://discourse.paraview.org/t/how-to-add-a-reference-line-in-visualization/10781
**Category:** ParaView Support
**Tags:** python, vtk
**Created:** [November 17, 2022, 6:53am UTC](https://discourse.paraview.org/t/how-to-add-a-reference-line-in-visualization/10781 "2022-11-17T06:53:47Z")
**Posts on this page:** 3
**Page:** 1
### Author:  [@axelwang](https://discourse.paraview.org/u/axelwang)
#### Post date: [November 17, 2022, 6:53am UTC](https://discourse.paraview.org/t/how-to-add-a-reference-line-in-visualization/10781/1 "2022-11-17T06:53:47Z")
Hey,
I want to simply add a reference line in my model like the following (where the line is hand-drawn):
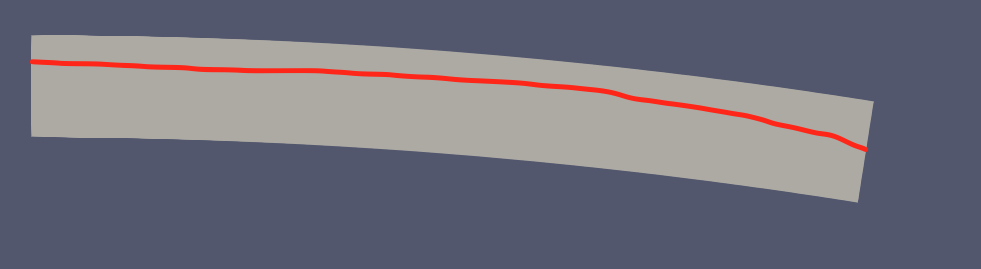
I have x, y, z coordinates of the line, and from what I can find about `pyvtk` it seems `pyvtk.RectilinearGrid` is a good choise, so I have the following python code:
```auto
vtk_file = destDir + "example.vtk"
exampleCurve = pyvtk.RectilinearGrid(x,y,z)
vtk = pyvtk.VtkData(exampleCurve,"")
vtk.tofile(vtk_file,'binary')
```
When I open the vtk file produced in paraview, the following is what I get.

It seems I can only view this as an outline, and if I click any other forms of representation, ParaView immediately crashes.
Please note that I simply wanted to plot a structure, so `pyvtk.VtkData(exampleCurve,"")` does not provide any field data on to the curve.
I have two questions now.
- What is the best way to plot a reference line/curve or any structure without field data in paraview?
- What is a good reference to learn more about pyvtk. I didn’t find any good resourced or even documentation online.
---
### Author:  [@cory.quammen](https://discourse.paraview.org/u/cory.quammen)
#### Post date: [November 17, 2022, 11:20am UTC](https://discourse.paraview.org/t/how-to-add-a-reference-line-in-visualization/10781/2 "2022-11-17T11:20:37Z")
> [@axelwang](#):
>
> What is the best way to plot a reference line/curve or any structure without field data in paraview?
RectilinearGrid is a good choice _if_ you have a grid of points. You have a curve, so a better choice would be a PolyData object with either a series of line segment cells or a polyline.
> [@axelwang](#):
>
> What is a good reference to learn more about pyvtk. I didn’t find any good resourced or even documentation online.
PyVTK is a separate [project](https://github.com/pearu/pyvtk) from ParaView. It looks like it hasn’t been maintained in 5 years, so I’m not sure where you could seek support.
[PyVista](https://docs.pyvista.org/) on the other hand, is under active development and has a large community. I recommend using that instead of PyVTK.
---
### Author:  [@axelwang](https://discourse.paraview.org/u/axelwang)
#### Post date: [November 18, 2022, 4:12am UTC](https://discourse.paraview.org/t/how-to-add-a-reference-line-in-visualization/10781/3 "2022-11-18T04:12:49Z")
Thank you so much @cory.quammen ! PyVista works very well!