# How to display the time tracker in a chart with a custom variable as X array
**URL:** https://discourse.paraview.org/t/how-to-display-the-time-tracker-in-a-chart-with-a-custom-variable-as-x-array/4484
**Category:** ParaView Support
**Created:** [June 3, 2020, 9:21am UTC](https://discourse.paraview.org/t/how-to-display-the-time-tracker-in-a-chart-with-a-custom-variable-as-x-array/4484 "2020-06-03T09:21:37Z")
**Posts on this page:** 3
**Page:** 1
### Author:  [@ANON1](https://discourse.paraview.org/u/ANON1)
#### Post date: [June 3, 2020, 9:21am UTC](https://discourse.paraview.org/t/how-to-display-the-time-tracker-in-a-chart-with-a-custom-variable-as-x-array/4484/1 "2020-06-03T09:21:38Z")
Hello,
I am plotting some data in chart over time. If I use the **Time** as the X array name, the time marker can be shown in the chart. However, If I change the X array name to another variable, in my example, avg(alpha) I can’t see the Time tracker anymore:
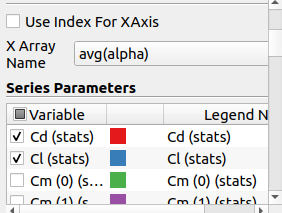
Could you please help me?
---
### Author:  [@utkarsh.ayachit](https://discourse.paraview.org/u/utkarsh.ayachit)
#### Post date: [June 3, 2020, 11:20am UTC](https://discourse.paraview.org/t/how-to-display-the-time-tracker-in-a-chart-with-a-custom-variable-as-x-array/4484/2 "2020-06-03T11:20:27Z")
If you change the X array to be something other that Time, it no longer makes sense to show a Time marker since there’s no assurance that the Time marker will even be straight vertical line. For example Time 0 and Time 1 may have the value for the avg(alpha) and in which case both those values will be plotted as the same X location.
---
### Author:  [@ANON1](https://discourse.paraview.org/u/ANON1)
#### Post date: [June 3, 2020, 12:34pm UTC](https://discourse.paraview.org/t/how-to-display-the-time-tracker-in-a-chart-with-a-custom-variable-as-x-array/4484/3 "2020-06-03T12:34:18Z")
Thank you for your reply.
I wonder if there is any workaround to that, something like: displaying a dot that moves on the chart according to time value.
Thanks