# How to enclose a figure inside a boundary
**URL:** https://discourse.paraview.org/t/how-to-enclose-a-figure-inside-a-boundary/11486
**Category:** ParaView Support
**Created:** [February 24, 2023, 1:16pm UTC](https://discourse.paraview.org/t/how-to-enclose-a-figure-inside-a-boundary/11486 "2023-02-24T13:16:38Z")
**Posts on this page:** 4
**Page:** 1
### Author:  [@mukul](https://discourse.paraview.org/u/mukul)
#### Post date: [February 24, 2023, 1:16pm UTC](https://discourse.paraview.org/t/how-to-enclose-a-figure-inside-a-boundary/11486/1 "2023-02-24T13:16:38Z")
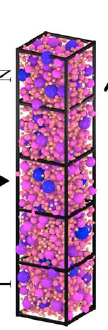
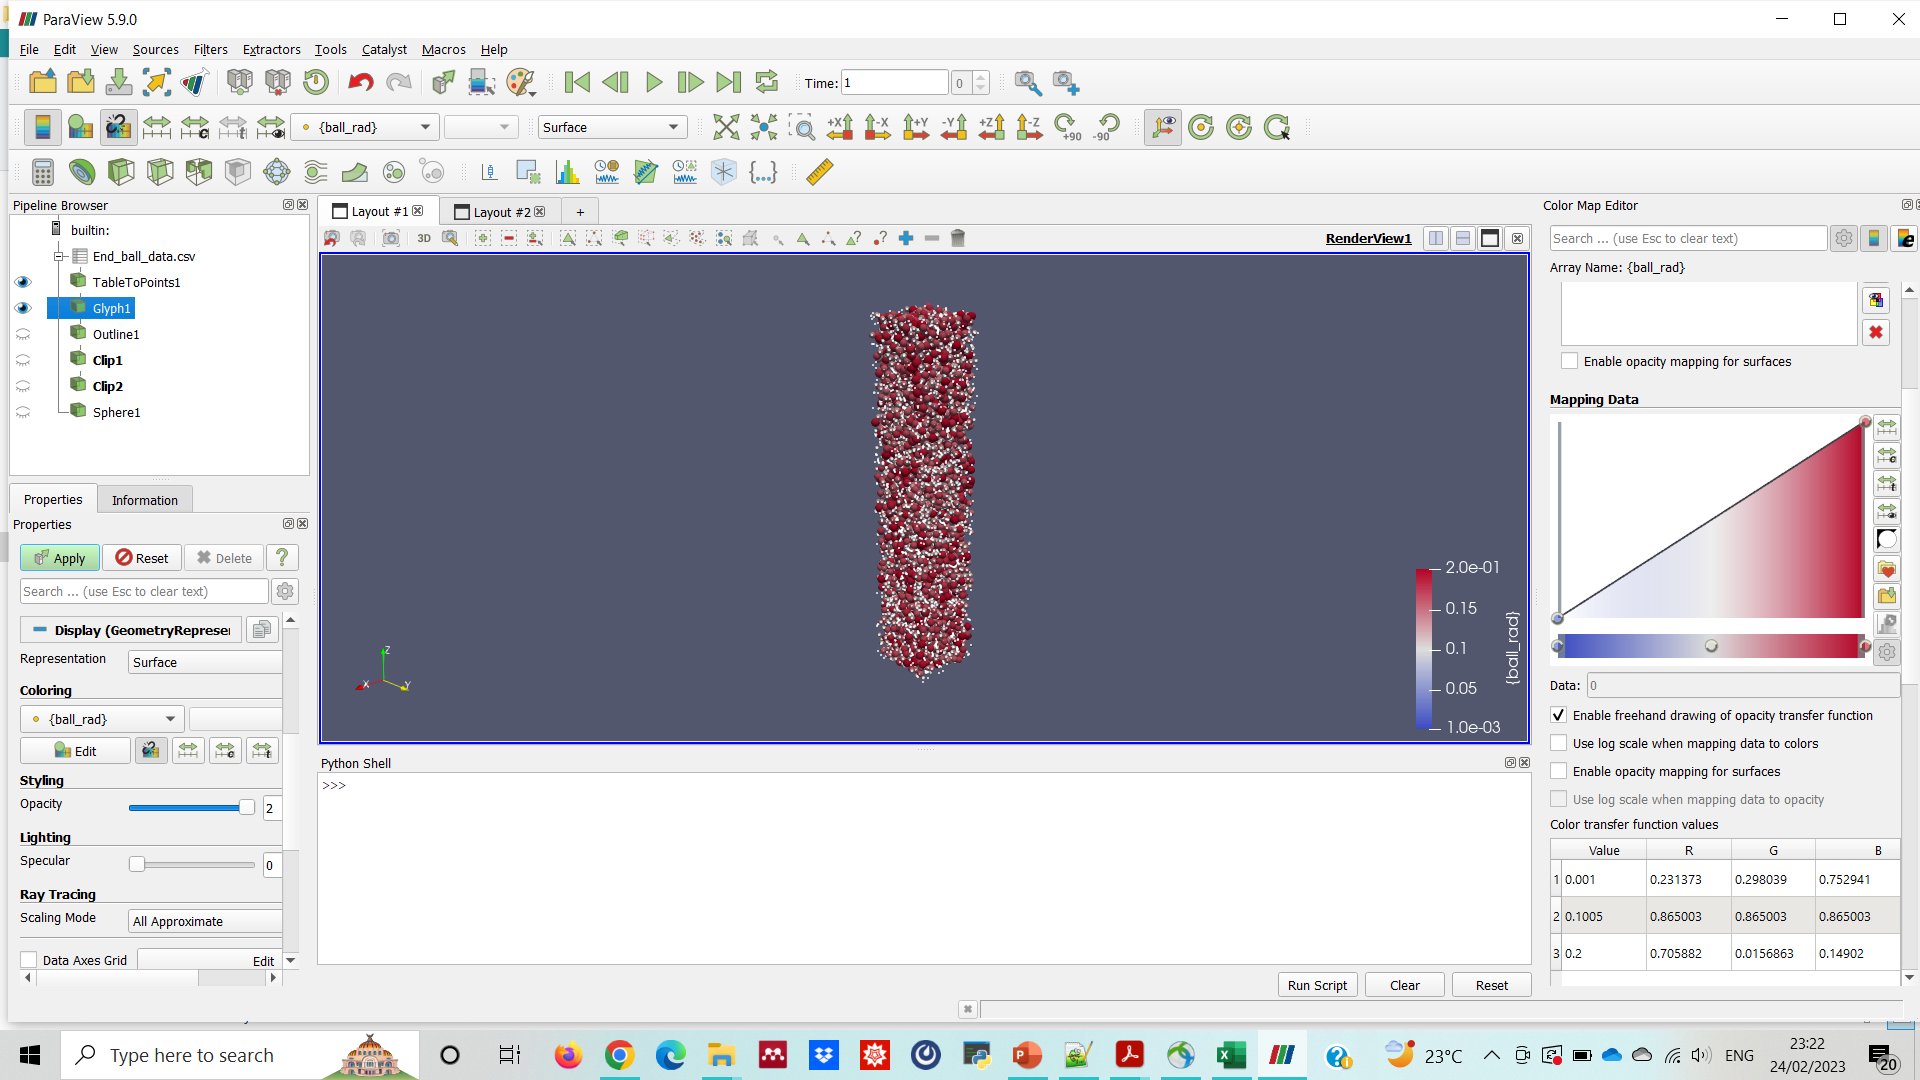
Hi. I want to enclose my figure inside a cubiodal boundary as shown in Fig 1 (figure attached). How can I do that in paraview?
I have also attached the vtk file for data on my figure.
[pfc\_data.vtk](https://discourse.paraview.org/uploads/short-url/q08TOEO8ChiIfoJacTkhXILRf6O.vtk) (492.7 KB)
---
### Author:  [@Kenneth\_Moreland](https://discourse.paraview.org/u/Kenneth_Moreland)
#### Post date: [February 24, 2023, 4:18pm UTC](https://discourse.paraview.org/t/how-to-enclose-a-figure-inside-a-boundary/11486/2 "2023-02-24T16:18:58Z")
I am confused by this question. If you want a box around your geometry, you can use the `Outline` filter. I see from your screenshot that you must have already tried that, so you must be asking something else.
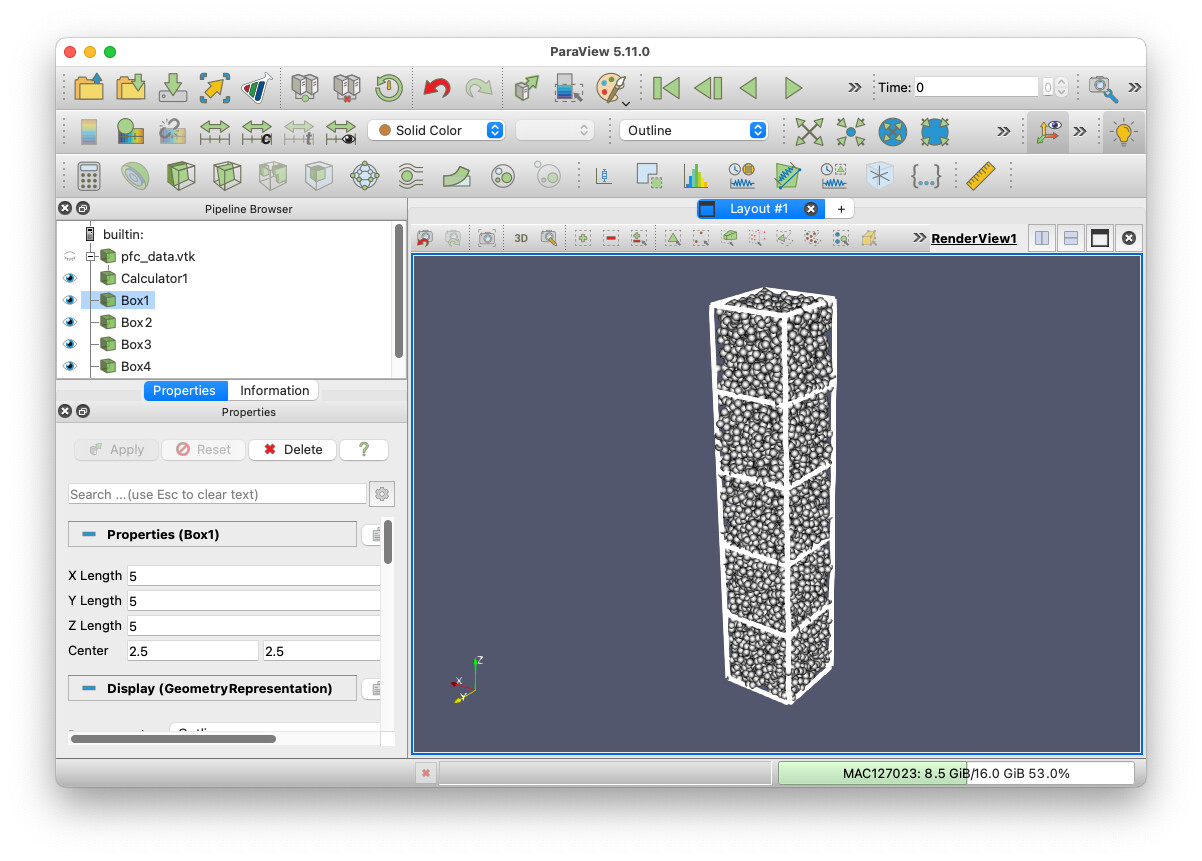
The other image you posted shows 5 boxes stacked over the spheres. There is no automatic way to do that, but you can create that by creating `Box` sources. You can use the parameters of the `Box` source to place it where you want (or you can use the `Transform` filter to move it). By default, the `Box` will show as a solid box, but change the representation (middle toolbar, about in the middle) from `Surface` to `Outline`. You can also adjust the line width.
Here is a screenshot of what I did along with a state file for what I did.
[boxes.pvsm](https://discourse.paraview.org/uploads/short-url/8oc7BYczsXn6zElYxgpDVdh3HFq.pvsm) (836.4 KB)
---
### Author:  [@mukul](https://discourse.paraview.org/u/mukul)
#### Post date: [February 25, 2023, 1:16am UTC](https://discourse.paraview.org/t/how-to-enclose-a-figure-inside-a-boundary/11486/3 "2023-02-25T01:16:39Z")
Hi. thank you for your reply. I have two more questions on the same problem
1. How do I change the line width of boxes
2. I want a custom colormap for the spheres inside the box according to their radius. I have attached an excel file for the RGB values in the form (data-value, red, green, blue). How can i do that?
I tried to change the colormap using the following code in python shell (as given in Paraview documentation 3.3) but it didn’t work:
colorMap = GetColorTransferFunction(‘ball\_rad’)
colorMap.RGBPoints = [1.0, 0.705, 0.015, 0.149,
5.0, 0.865, 0.865, 0.865,
10.0, 0.627, 0.749, 1.0,
19.9495, 0.231373, 0.298039, 0.752941]
Note: in the following code RGB values are just for reference. In actual I want the RGB values from the excel file
[rgb values.xlsx](https://discourse.paraview.org/uploads/short-url/rZOLGIOvaeTICwKackF1wVIeZIA.xlsx) (18.3 KB)
---
### Author:  [@Kenneth\_Moreland](https://discourse.paraview.org/u/Kenneth_Moreland)
#### Post date: [March 1, 2023, 7:12pm UTC](https://discourse.paraview.org/t/how-to-enclose-a-figure-inside-a-boundary/11486/4 "2023-03-01T19:12:15Z")
> [@mukul](#):
>
> How do I change the line width of boxes
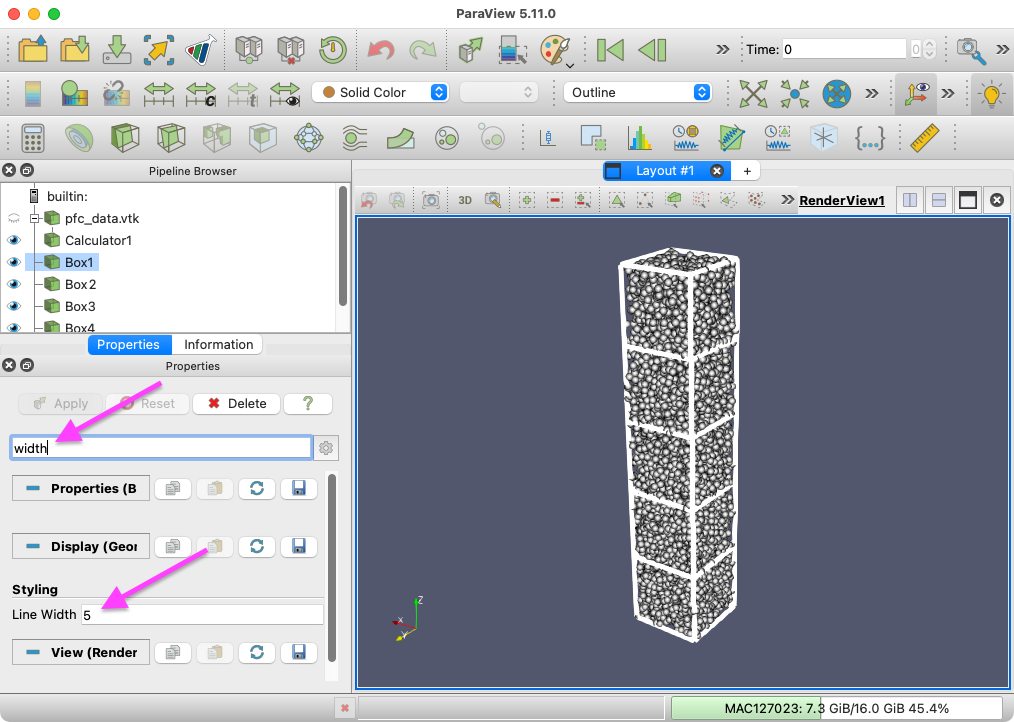
There is a display property named `Line Width` in the display properties that can be used to adjust the line width. It is an “advanced” property somewhat hard to find, so I usually just type `width` in the search box at the top of the properties panel to find it.
> [@mukul](#):
>
> I want a custom colormap for the spheres inside the box according to their radius. I have attached an excel file for the RGB values in the form (data-value, red, green, blue). How can i do that?
The colors are controlled through the color map editor. Information about editing color maps can be found [in the ParaView user’s guide](https://docs.paraview.org/en/v5.11.0/ReferenceManual/colorMapping.html?highlight=colors#editing-the-transfer-functions-in-paraview) and numerous other sources.
You can import and export color maps from the presets dialog box . The configuration for a preset is in json format, so you cannot just load in your excel file, but it is pretty easy to convert. The format looks like this:
```json
[
{
"ColorSpace" : "Lab",
"Creator" : "mukul",
"Name" : "mukul's custom colors for ball radius",
"RGBPoints" :
[
# Comma separated list of s, r, g, b points.
]
}
]
```
Replace the comment with a comma-separated list of all the values in your excel file. You can do that by writing out the data as a csv file, adding a comma to the end of each line, and then copy-pasting it to this location in the json file. Here is a color preset containing the colors you provided: [ball-radius-colors.json](https://discourse.paraview.org/uploads/short-url/h9bBMHt4uCCtQd0slnc5EGniXoY.json). Edit as you see appropriate.