# How to image 2D data in txt file
**URL:** https://discourse.paraview.org/t/how-to-image-2d-data-in-txt-file/9660
**Category:** ParaView Support
**Created:** [May 23, 2022, 5:39am UTC](https://discourse.paraview.org/t/how-to-image-2d-data-in-txt-file/9660 "2022-05-23T05:39:10Z")
**Posts on this page:** 6
**Page:** 1
### Author:  [@Changwan\_Sun](https://discourse.paraview.org/u/Changwan_Sun)
#### Post date: [May 23, 2022, 5:39am UTC](https://discourse.paraview.org/t/how-to-image-2d-data-in-txt-file/9660/1 "2022-05-23T05:39:10Z")
Dear all,
I can read a 2D text file with your kind answers for many questions. But, I do not know the next step, how to visualize the matrix in the Paraview. My data has this structure, 81 x 4096 matrix.
I followed this step:
1. opened the text file with Delimited text (CSV Reader).
2. changed the properties: deactivate the have headers.
3. changed the properties: " " in the Field Delimiter Characters.
4. changed the properties: activate the Merge Consecutive Delimiters
5. click “Apply”
6. click the filter, Table to Points, in the Filters tap.
**After this list of steps, I do not know how to image the matrix.**
When I click the X column or Y or Z, this show many fields. This data is only 2D data. Then I need two axes.
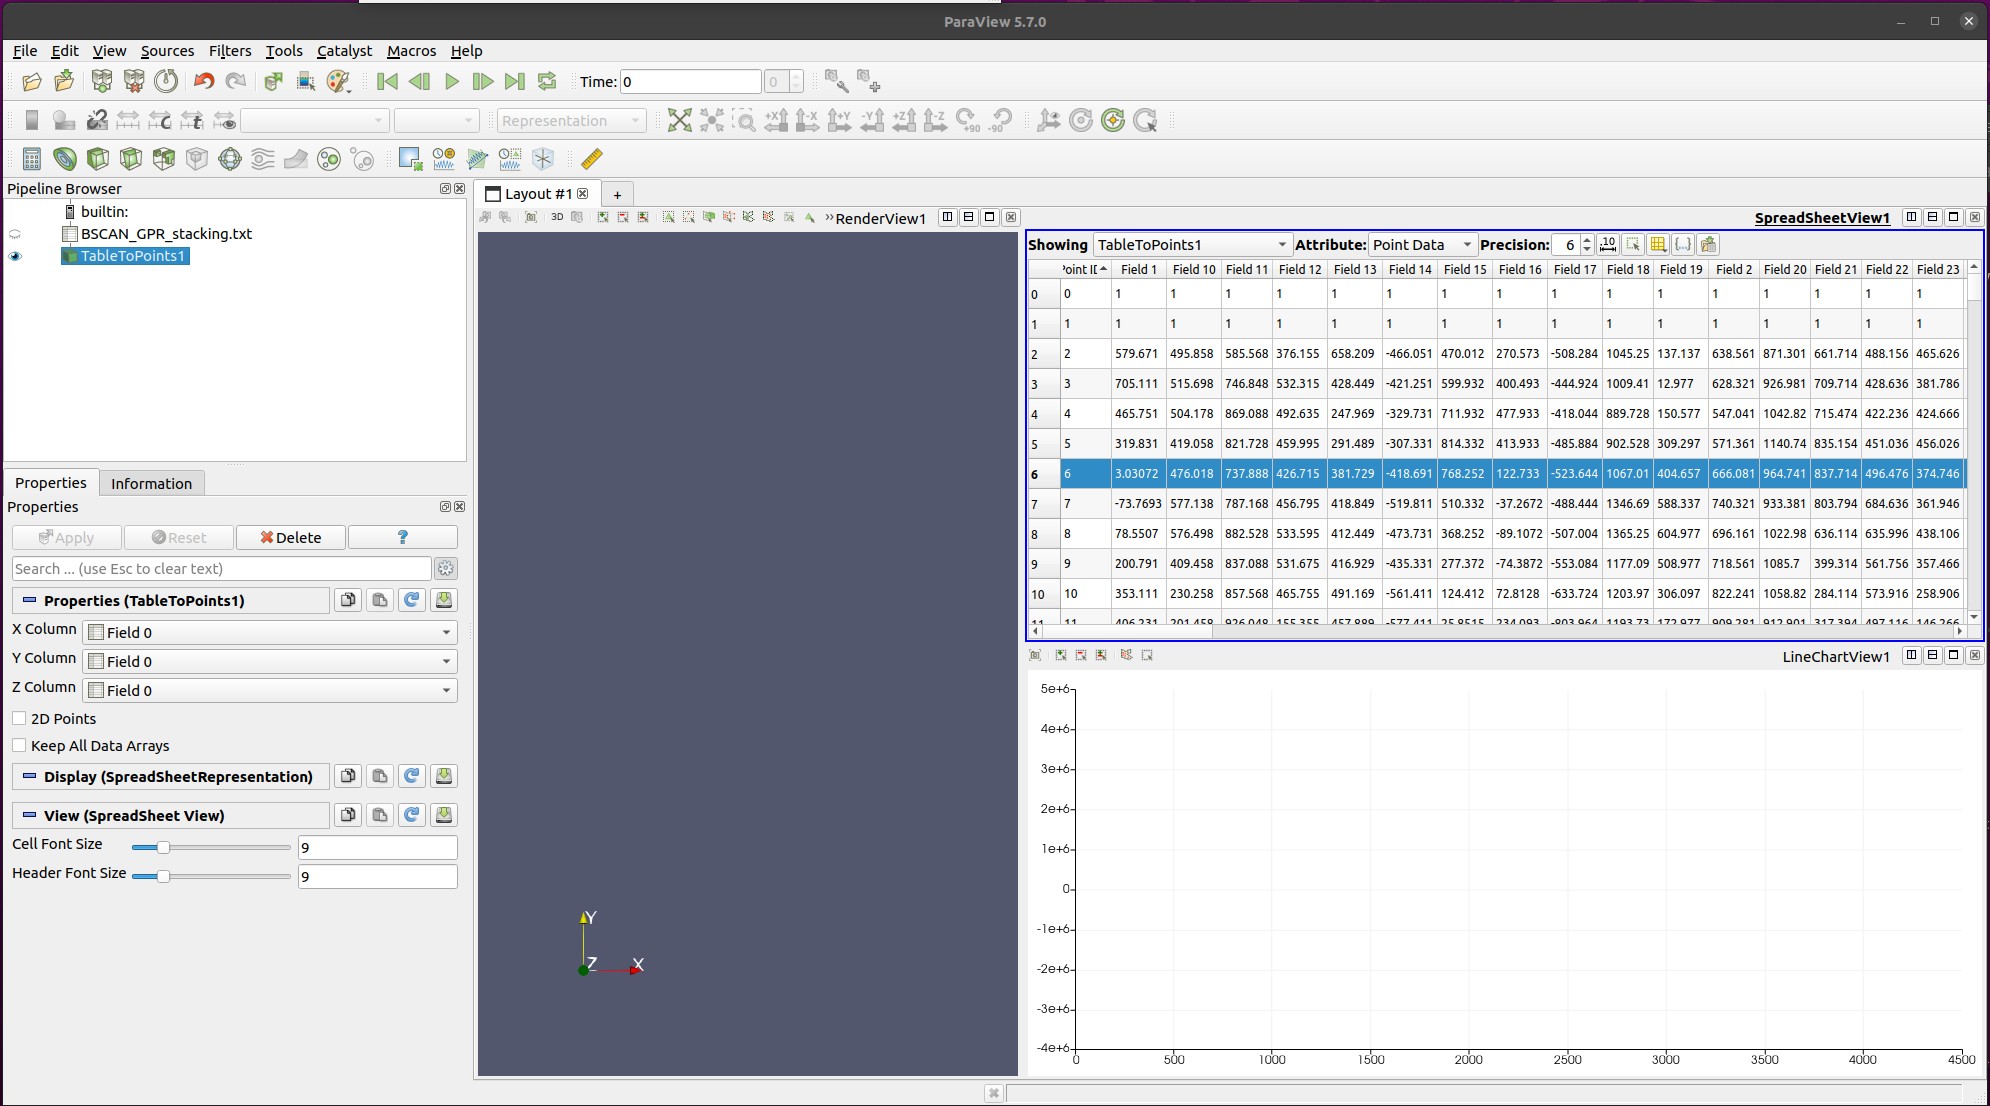
How can I image those fields?
I expect this kinds of image (some part of the matrix, ), which was visualized by gnuplot.
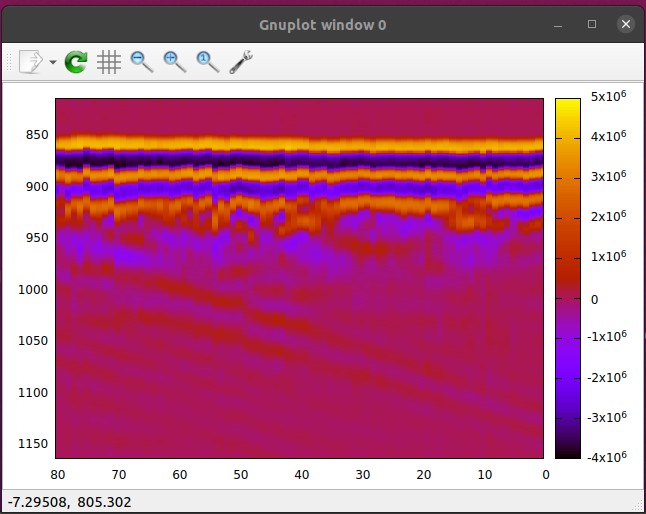
My final goal is to image 3D matrix in the Paraview. As a basics step, I hope to understand how to image the 2D matrix in the Paraview.
Help me out please!!
Thank you for reading this topic.
---
### Author:  [@Christos\_Tsolakis](https://discourse.paraview.org/u/Christos_Tsolakis)
#### Post date: [May 24, 2022, 2:30am UTC](https://discourse.paraview.org/t/how-to-image-2d-data-in-txt-file/9660/2 "2022-05-24T02:30:32Z")
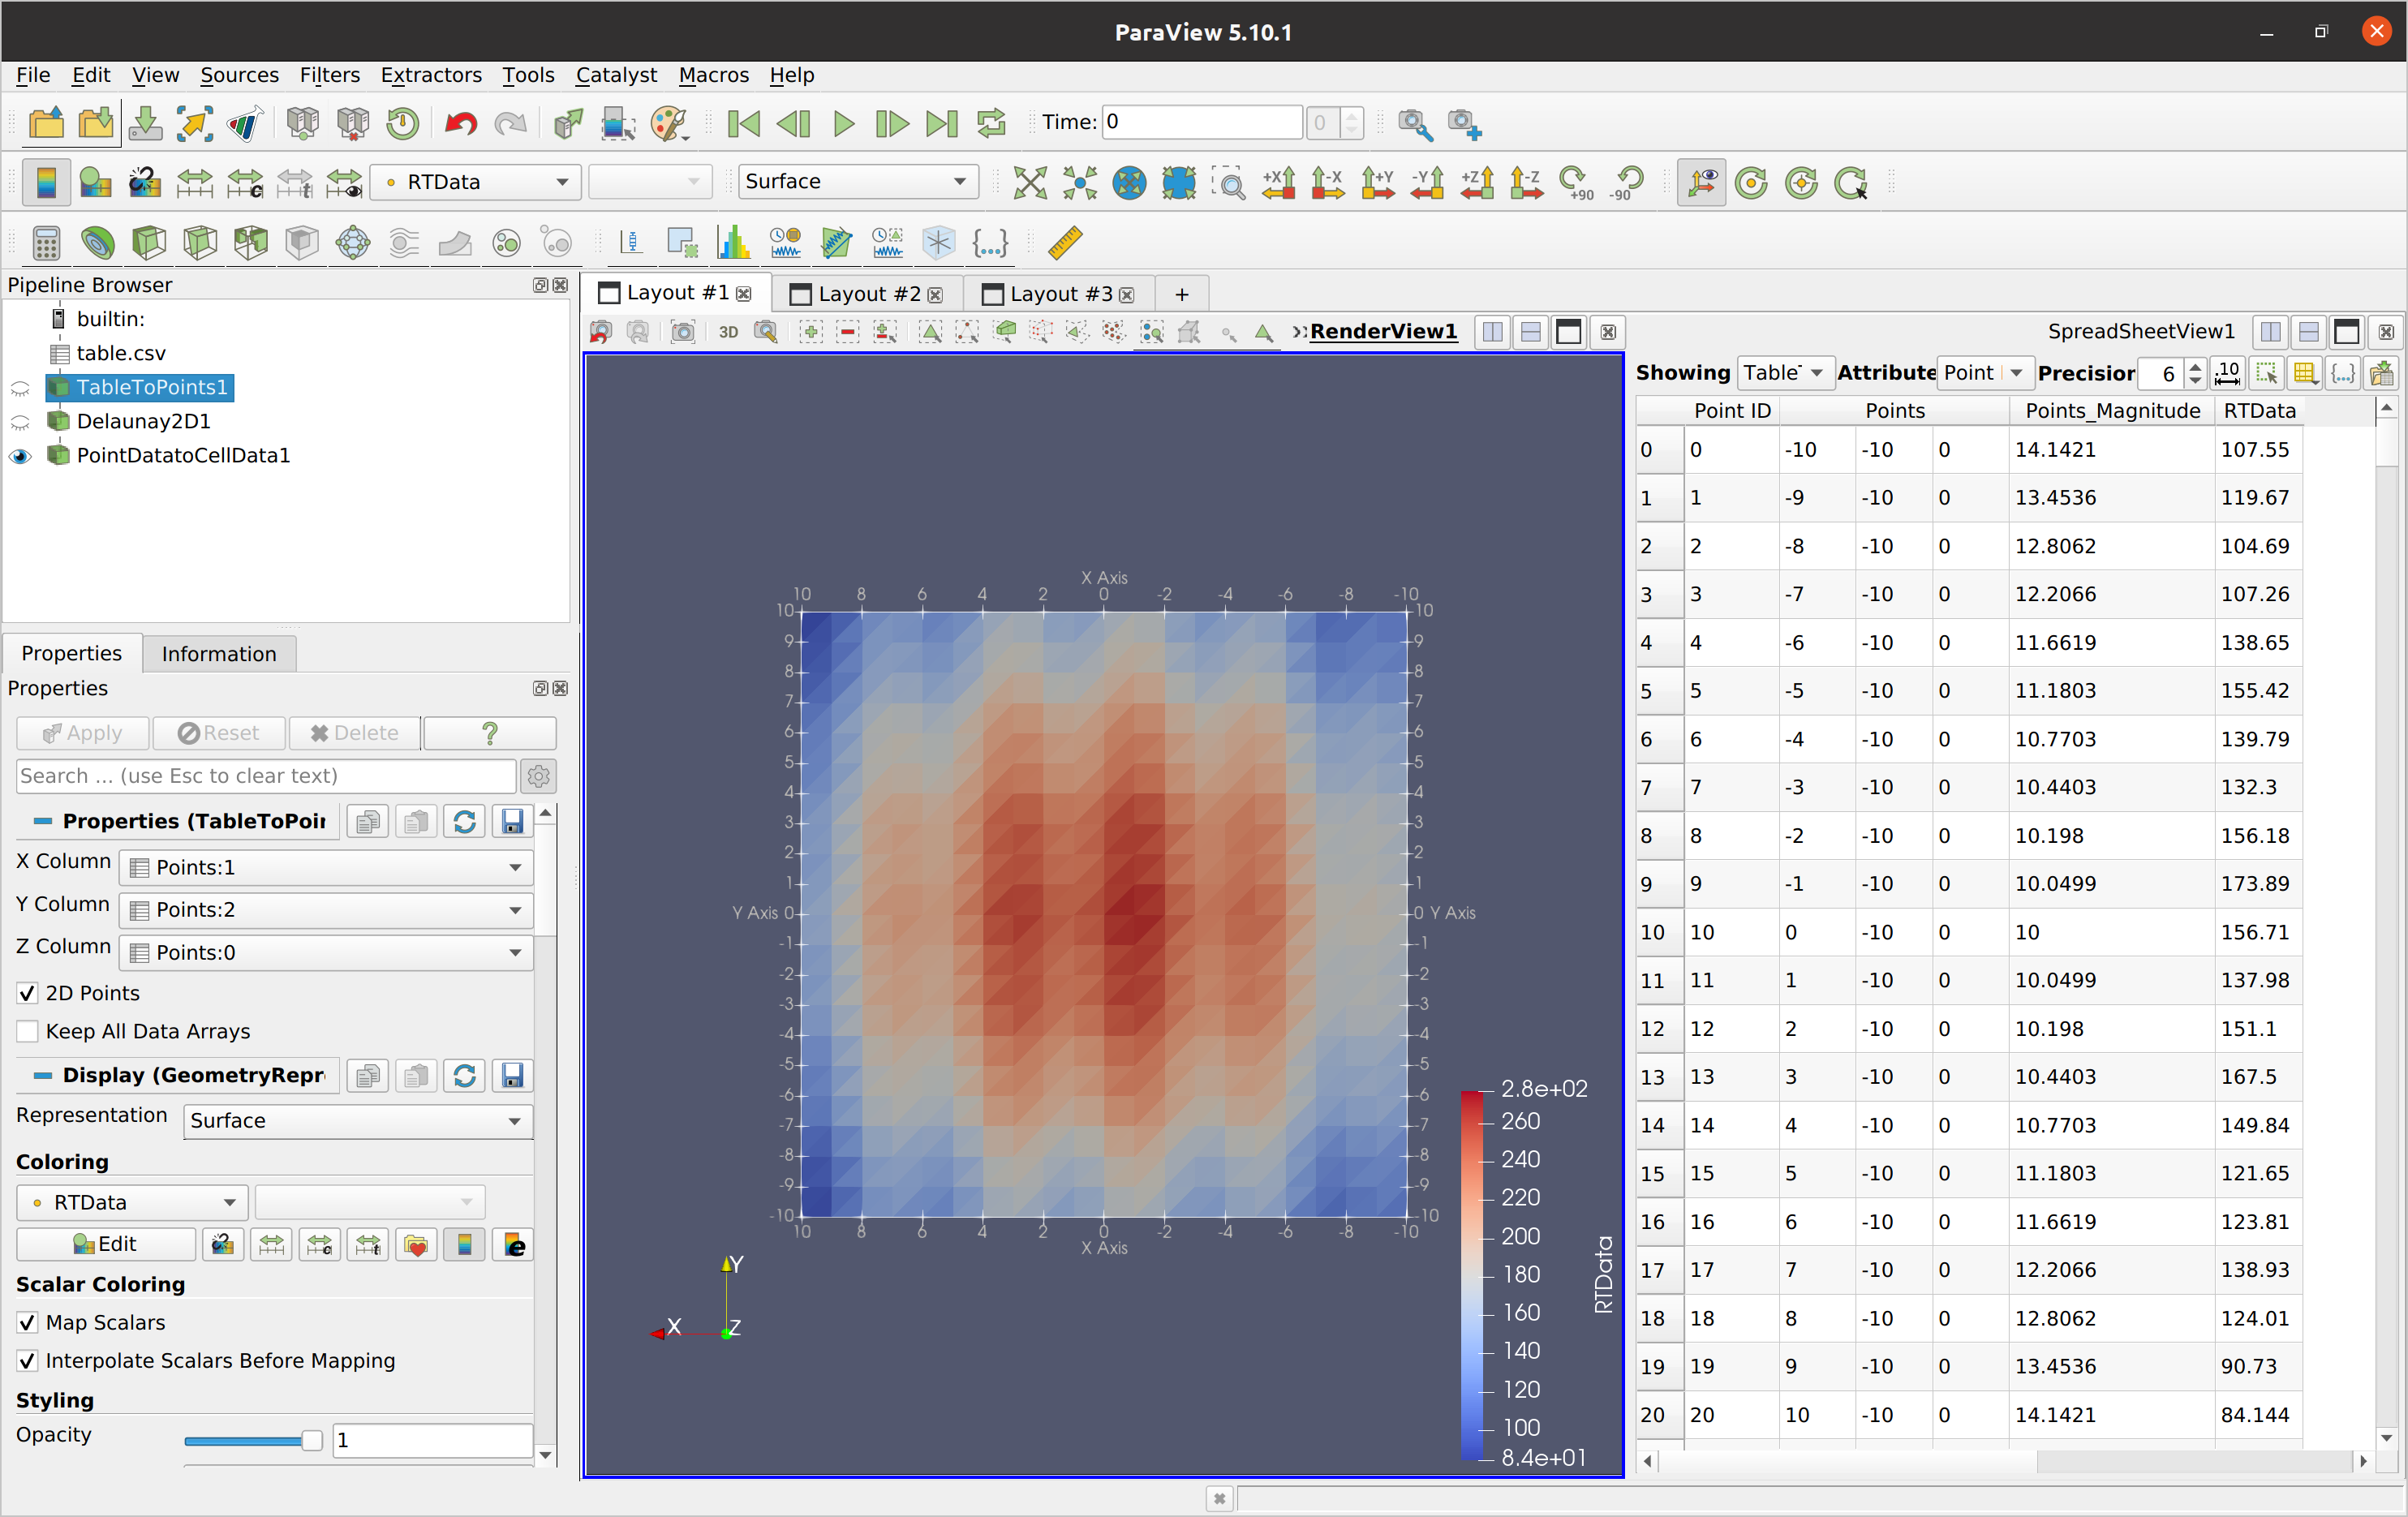
Check the Filter properties. `X Column`, `Y Column` should be mapped to the appropriate column of your table. Currently both of them point to `Field 0`. Check also the 2D Points checkbox. You can then use `Delaunay2D` and `PointDatatoCellData` to create an image similar to the one from gnuplot. See below
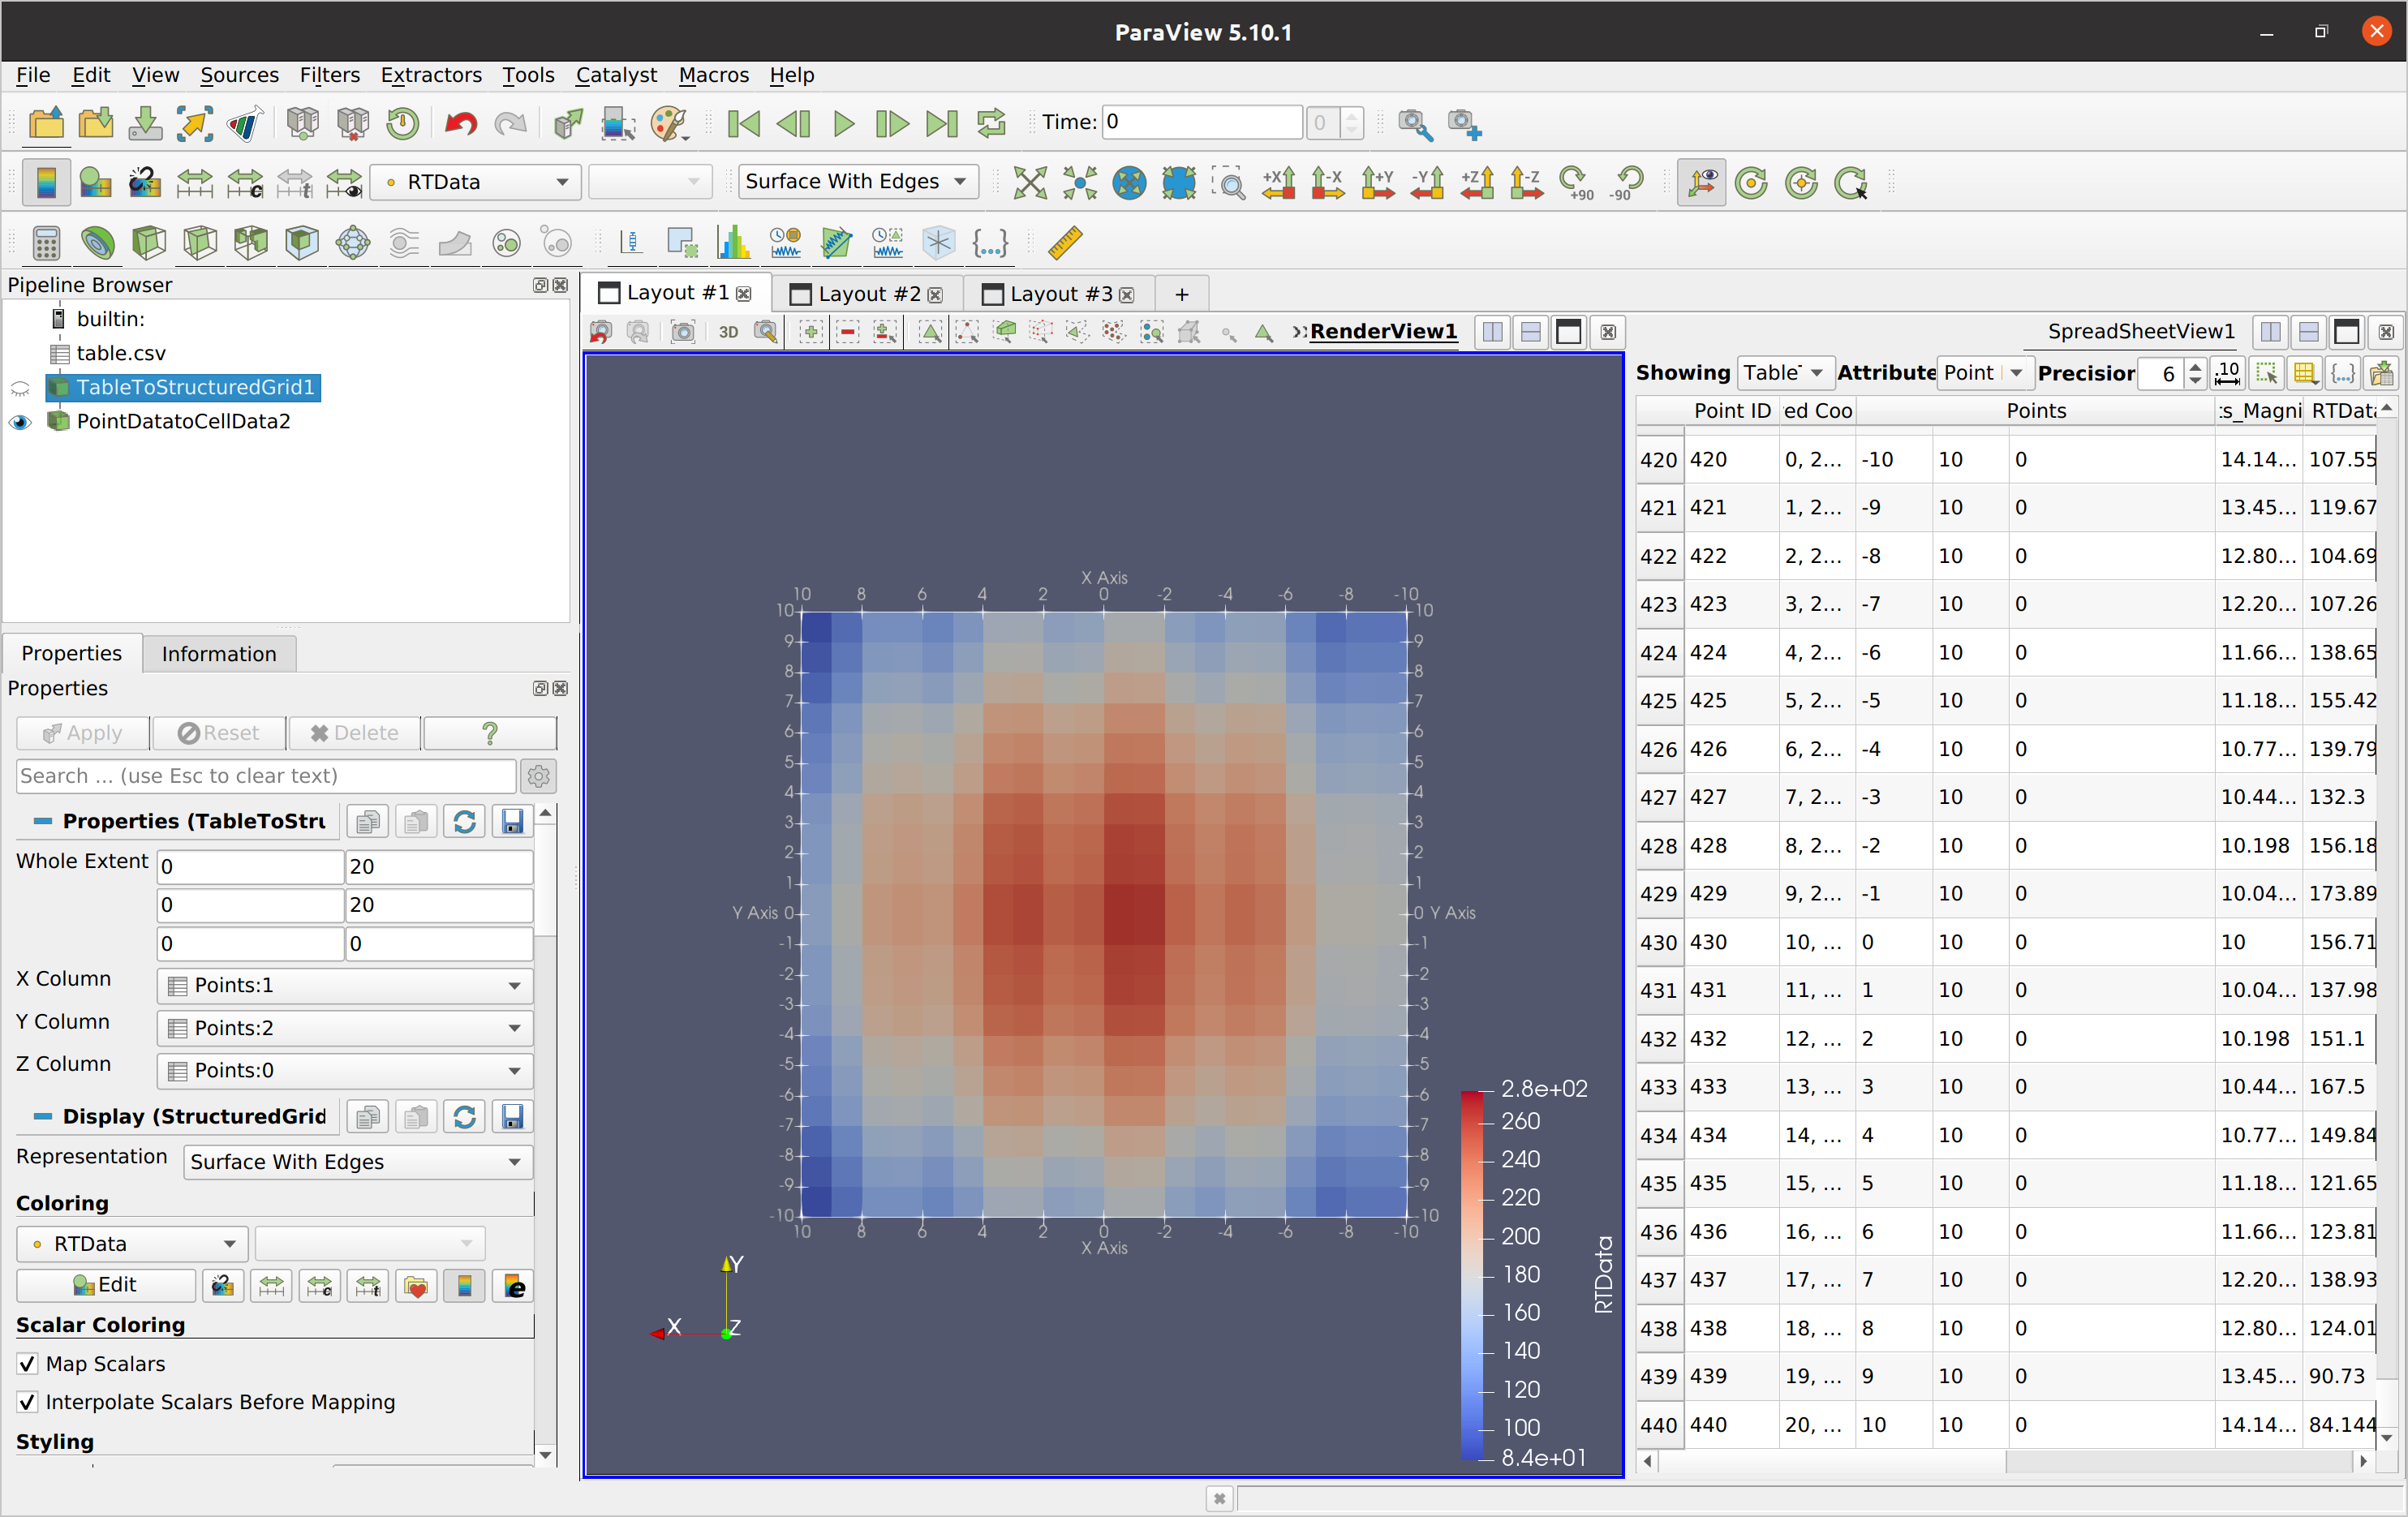
Even simpler you can use the `TableToStructuredGrid` Filter see:
---
### Author:  [@Changwan\_Sun](https://discourse.paraview.org/u/Changwan_Sun)
#### Post date: [July 5, 2022, 7:50am UTC](https://discourse.paraview.org/t/how-to-image-2d-data-in-txt-file/9660/3 "2022-07-05T07:50:59Z")
Sorry for too late reply. I totally forgot this posting. Thank you for your nice answer! I will try this!
---
### Author:  [@Changwan\_Sun](https://discourse.paraview.org/u/Changwan_Sun)
#### Post date: [September 3, 2022, 7:41am UTC](https://discourse.paraview.org/t/how-to-image-2d-data-in-txt-file/9660/4 "2022-09-03T07:41:00Z")
Hi, It’ been a while from your nice reply. Now I have been following the steps that you suggested.
My data set has the structure, 616 x 1547 (row x column).
1. You suggested to assign some field to each column. But I need all the field.
2.When I use the TableToStructure, I found this error message:
> vtkTableToStructuredGrid (0x7f7de8017740): The input table must have exactly 1 rows.
How to use all the rows and all the columns?
---
### Author:  [@Changwan\_Sun](https://discourse.paraview.org/u/Changwan_Sun)
#### Post date: [September 3, 2022, 8:24am UTC](https://discourse.paraview.org/t/how-to-image-2d-data-in-txt-file/9660/5 "2022-09-03T08:24:43Z")
I am trying smaller dataset with simple structure: 4 x 10 (row x column).
[test\_paraview.txt](https://discourse.paraview.org/uploads/short-url/rqlrM2vqiFTXtC56fAUl8ASiqJB.txt) (111 Bytes)
How to image this file in Paraview?
---
### Author:  [@Changwan\_Sun](https://discourse.paraview.org/u/Changwan_Sun)
#### Post date: [September 5, 2022, 5:43am UTC](https://discourse.paraview.org/t/how-to-image-2d-data-in-txt-file/9660/6 "2022-09-05T05:43:07Z")
I finally knew to image the 3D-structure text file by using paraview.
I followed this way to get the vtk file:
>
Thank you for everyone that read my post.