Got it.
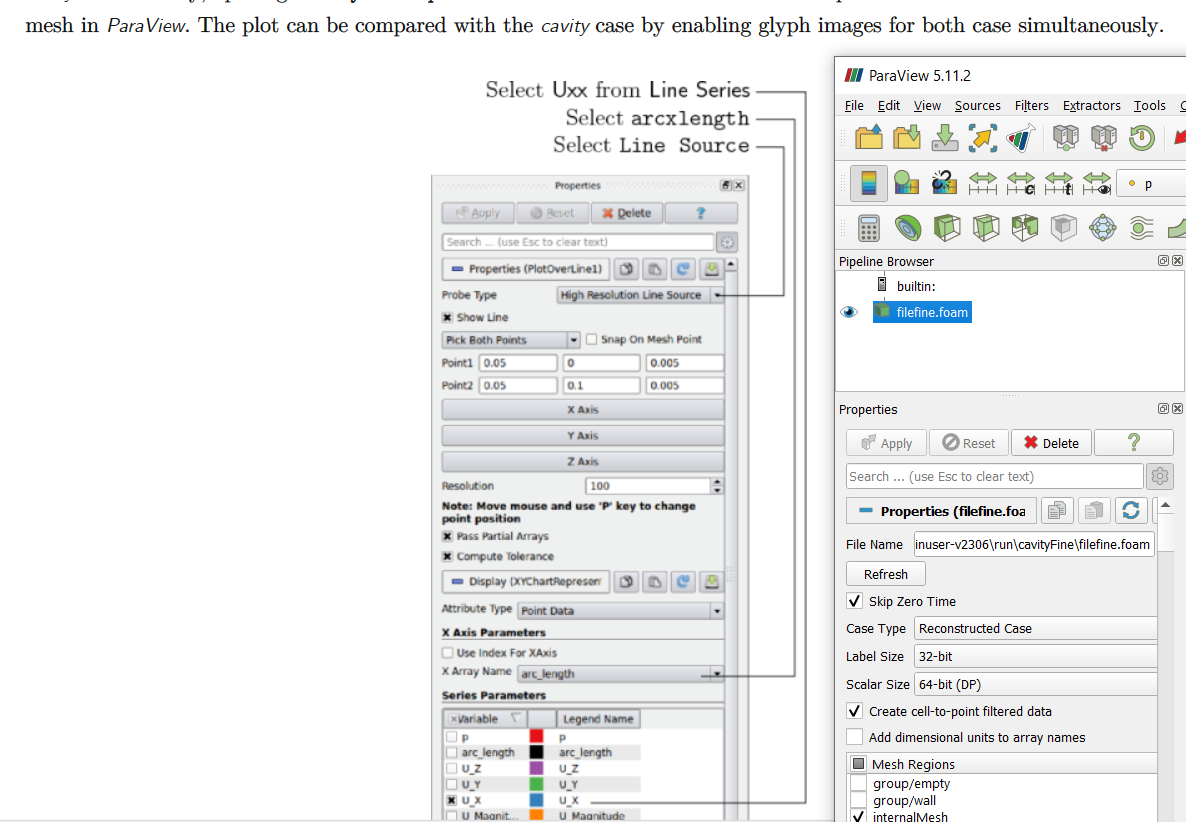
I am now working on the part where it says to “create a vector plot of the results”:
But I don’t see the same GUI setup, even though I already clicked Apply and refresh many times. Could you tell me why?