# How to pass (velocity) results through a function
**URL:** https://discourse.paraview.org/t/how-to-pass-velocity-results-through-a-function/9771
**Category:** ParaView Support
**Created:** [June 9, 2022, 2:33pm UTC](https://discourse.paraview.org/t/how-to-pass-velocity-results-through-a-function/9771 "2022-06-09T14:33:55Z")
**Posts on this page:** 5
**Page:** 1
### Author:  [@fvg](https://discourse.paraview.org/u/fvg)
#### Post date: [June 9, 2022, 2:33pm UTC](https://discourse.paraview.org/t/how-to-pass-velocity-results-through-a-function/9771/1 "2022-06-09T14:33:55Z")
To obtain results for chance a certain windspeed is exceeded, I want to take the results of a windspeed calculation though an interpolation function of the windspeed probability.
Essentially putting the results from this image:
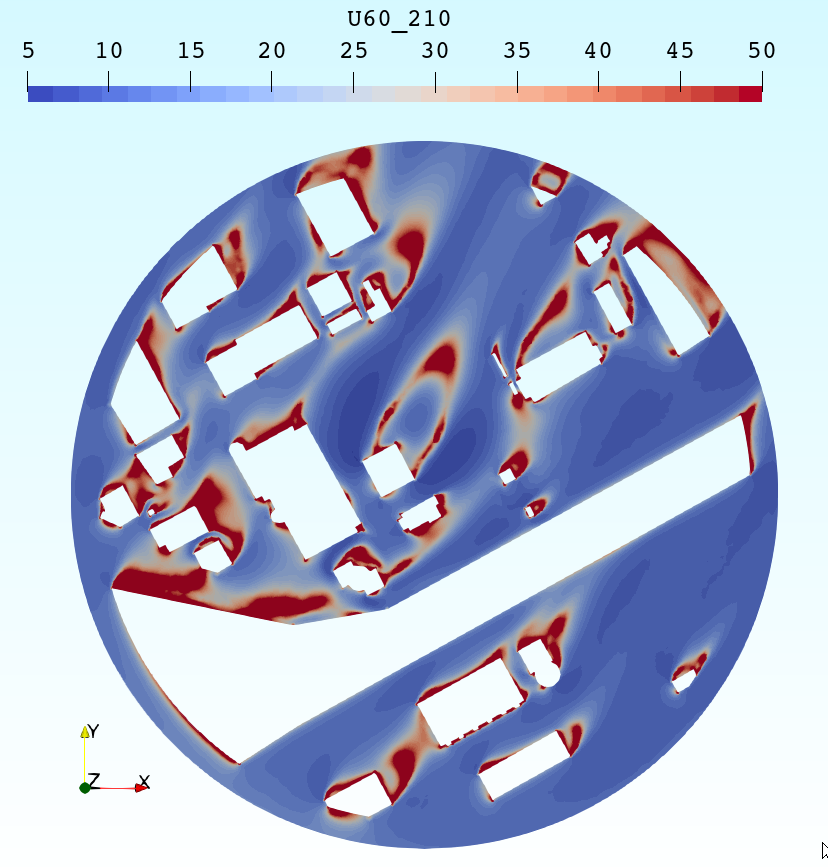
And pass it through this function to get the changes for each gridpoint:
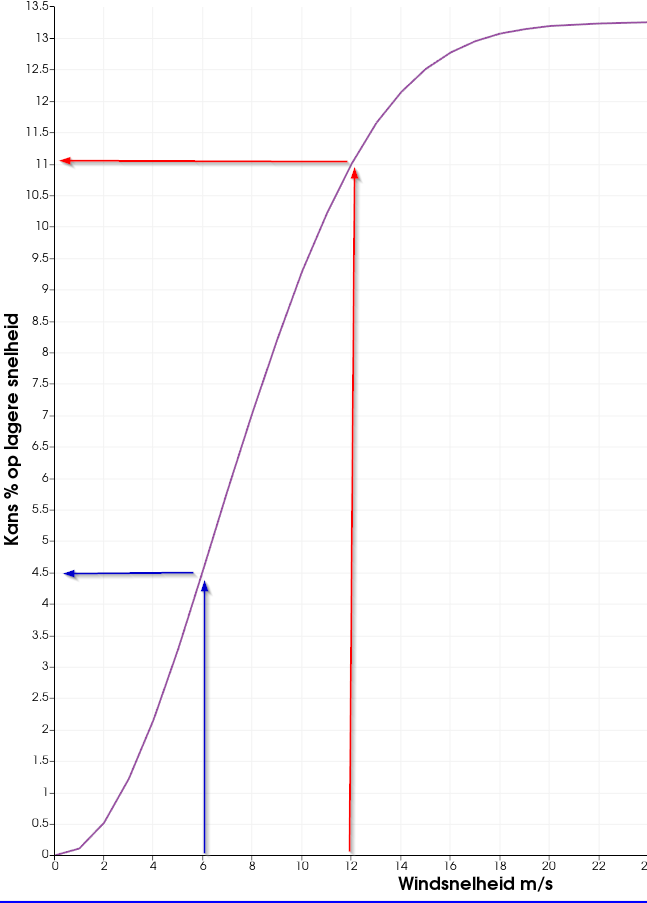
This would lead to the chance a certain windspeed is exceed at each location in the grid.
Is this possible in paraview?
---
### Author:  [@mwestphal](https://discourse.paraview.org/u/mwestphal)
#### Post date: [June 9, 2022, 3:15pm UTC](https://discourse.paraview.org/t/how-to-pass-velocity-results-through-a-function/9771/2 "2022-06-09T15:15:11Z")
Hi @fvg
I’m not sure to follow, are you looking for PlotOverLine filter ?
Best,
---
### Author:  [@fvg](https://discourse.paraview.org/u/fvg)
#### Post date: [June 9, 2022, 3:23pm UTC](https://discourse.paraview.org/t/how-to-pass-velocity-results-through-a-function/9771/3 "2022-06-09T15:23:20Z")
Hi Mathieu,
no that would be different. For all nodes I want the velocity converted to a chance, according to the interpolation function. So the result should be a surface plot, but now with the chances.
Does that make more sense?
best, Frank
---
### Author:  [@mwestphal](https://discourse.paraview.org/u/mwestphal)
#### Post date: [June 10, 2022, 6:57am UTC](https://discourse.paraview.org/t/how-to-pass-velocity-results-through-a-function/9771/4 "2022-06-10T06:57:20Z")
What is a chance ? How do you compute it ?
In any case, should be doable with a programmable filter.
---
### Author:  [@fvg](https://discourse.paraview.org/u/fvg)
#### Post date: [June 13, 2022, 6:45am UTC](https://discourse.paraview.org/t/how-to-pass-velocity-results-through-a-function/9771/5 "2022-06-13T06:45:50Z")
Hi Mathieu, the chance comes from a windrose (direction plus chance of a certain windspeed). The combination with the local velocities gives the chance a certain threshold windspeed is exceeded (nen8100).
> In any case, should be doable with a programmable filter.
So I’ll be reading through that then, thanks Mathieu.