# How to plot contour for Tecplot FEBRICK data
**URL:** https://discourse.paraview.org/t/how-to-plot-contour-for-tecplot-febrick-data/4036
**Category:** ParaView Support
**Created:** [April 12, 2020, 6:37pm UTC](https://discourse.paraview.org/t/how-to-plot-contour-for-tecplot-febrick-data/4036 "2020-04-12T18:37:44Z")
**Posts on this page:** 2
**Page:** 1
### Author:  [@yanb](https://discourse.paraview.org/u/yanb)
#### Post date: [April 12, 2020, 6:37pm UTC](https://discourse.paraview.org/t/how-to-plot-contour-for-tecplot-febrick-data/4036/1 "2020-04-12T18:37:44Z")
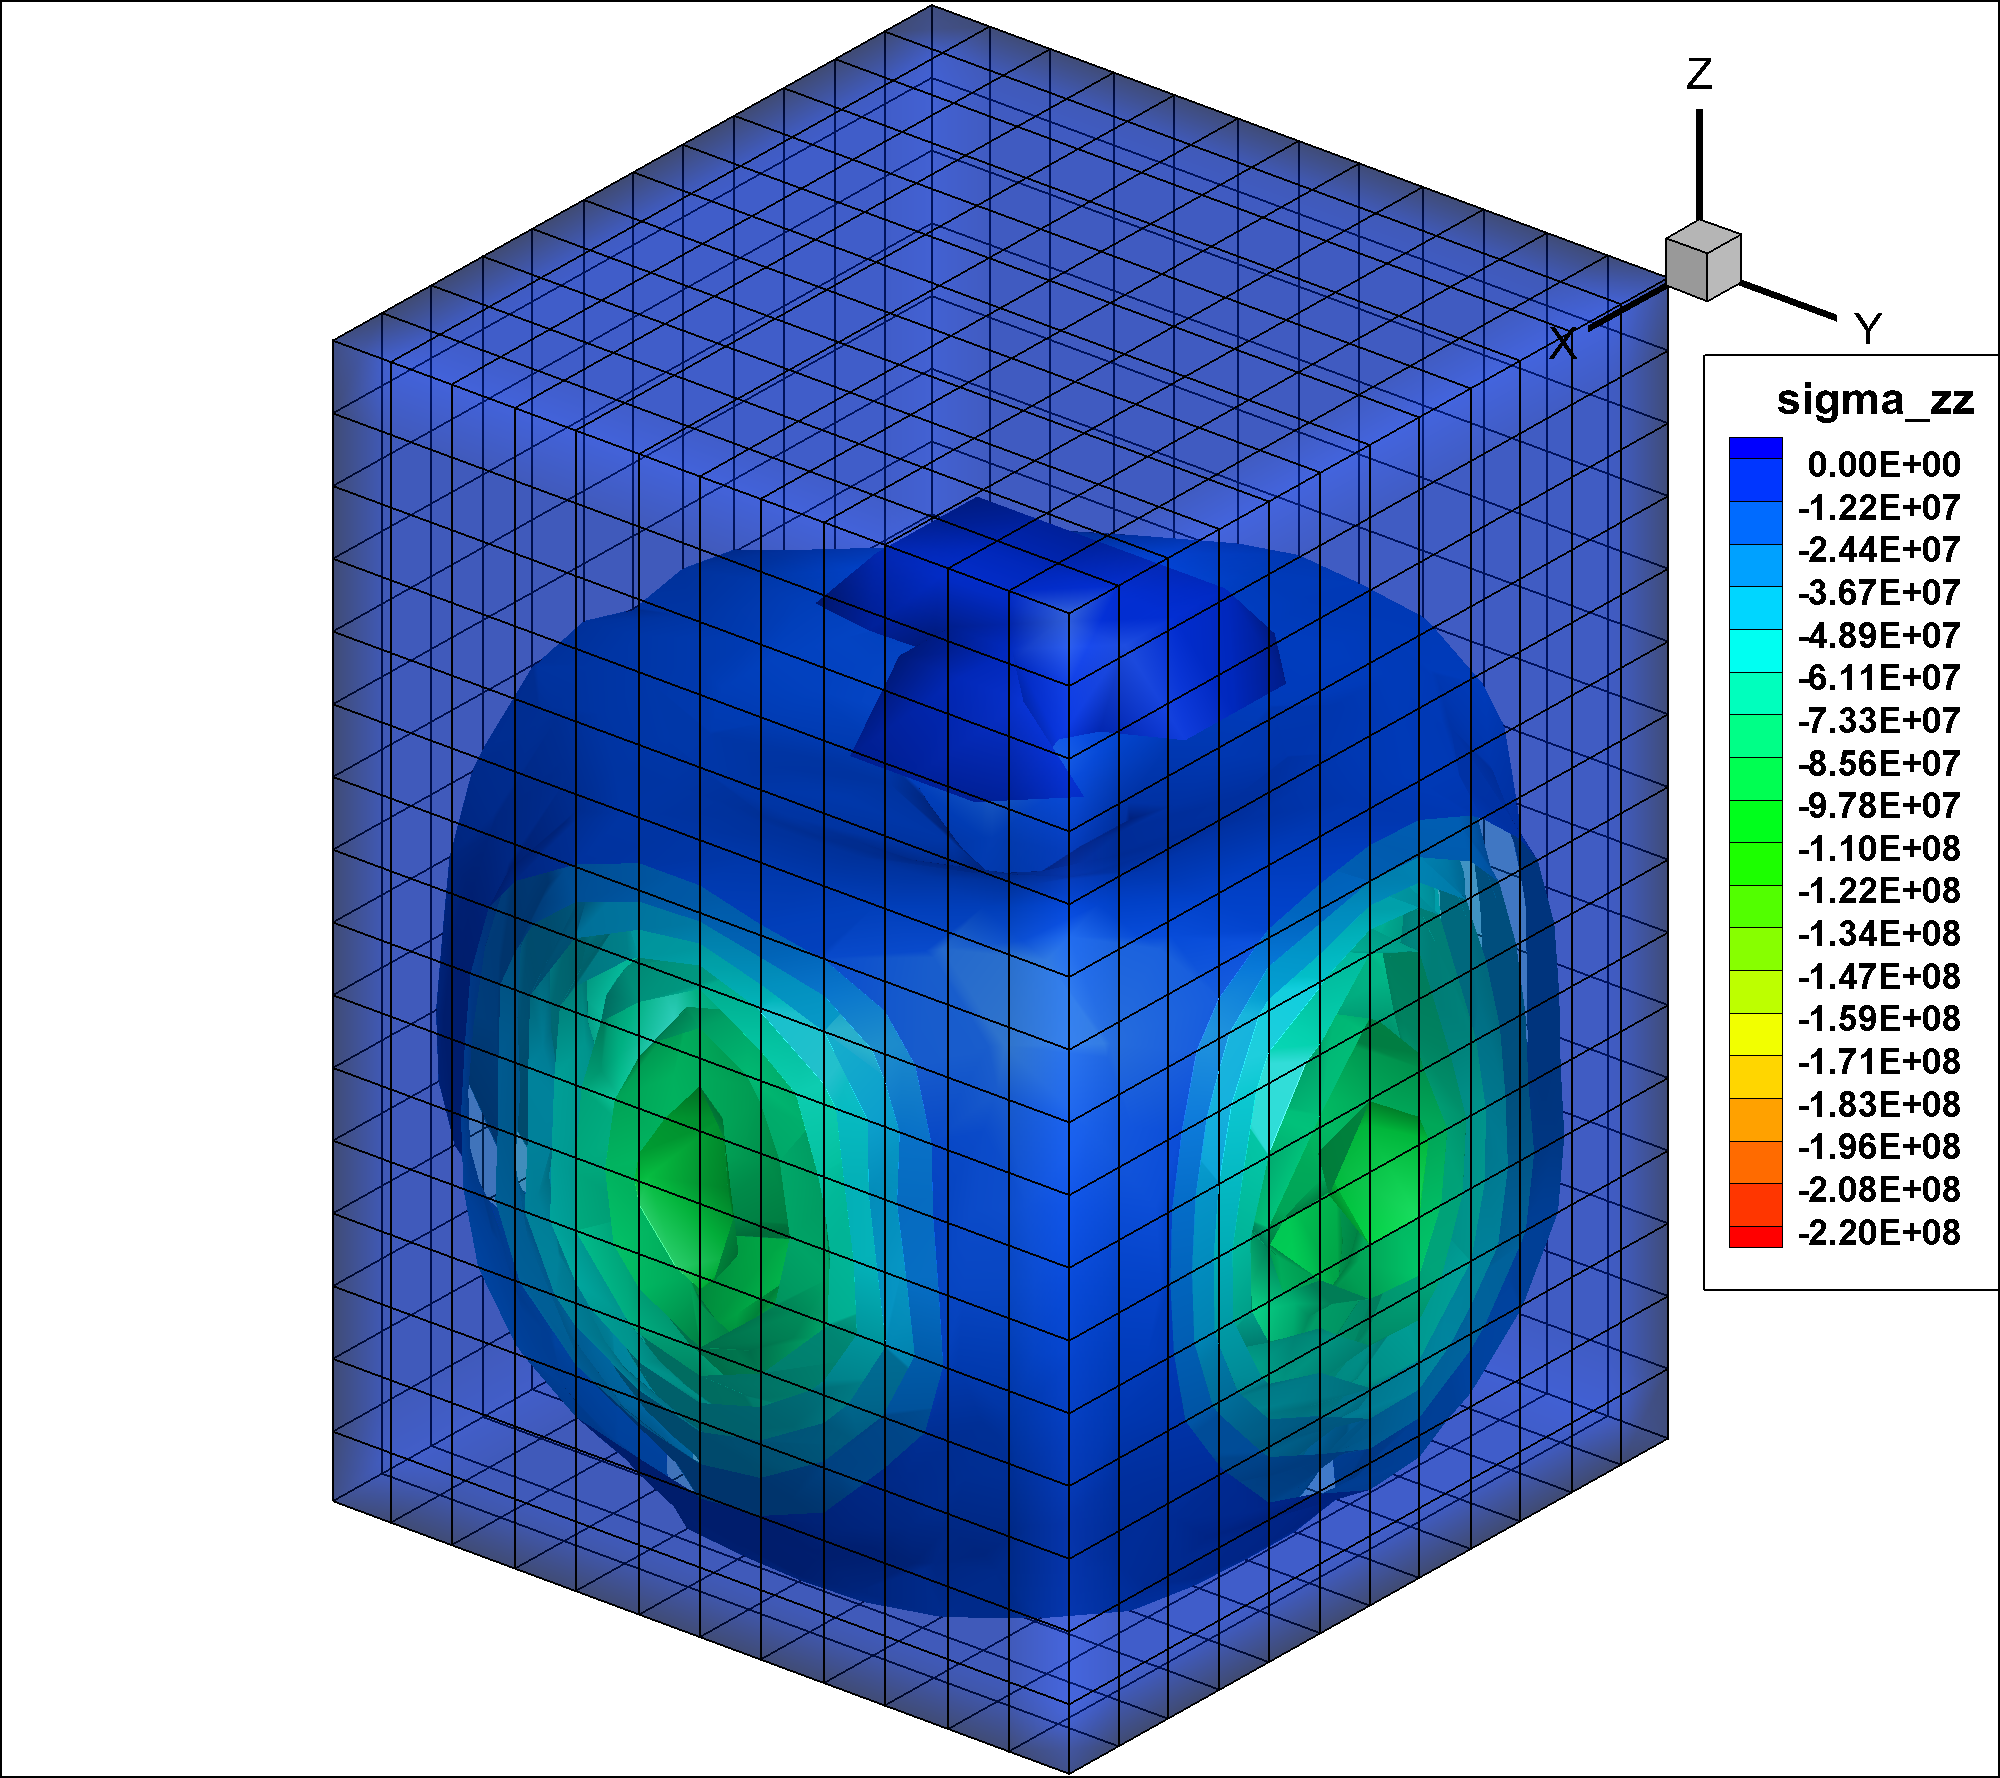
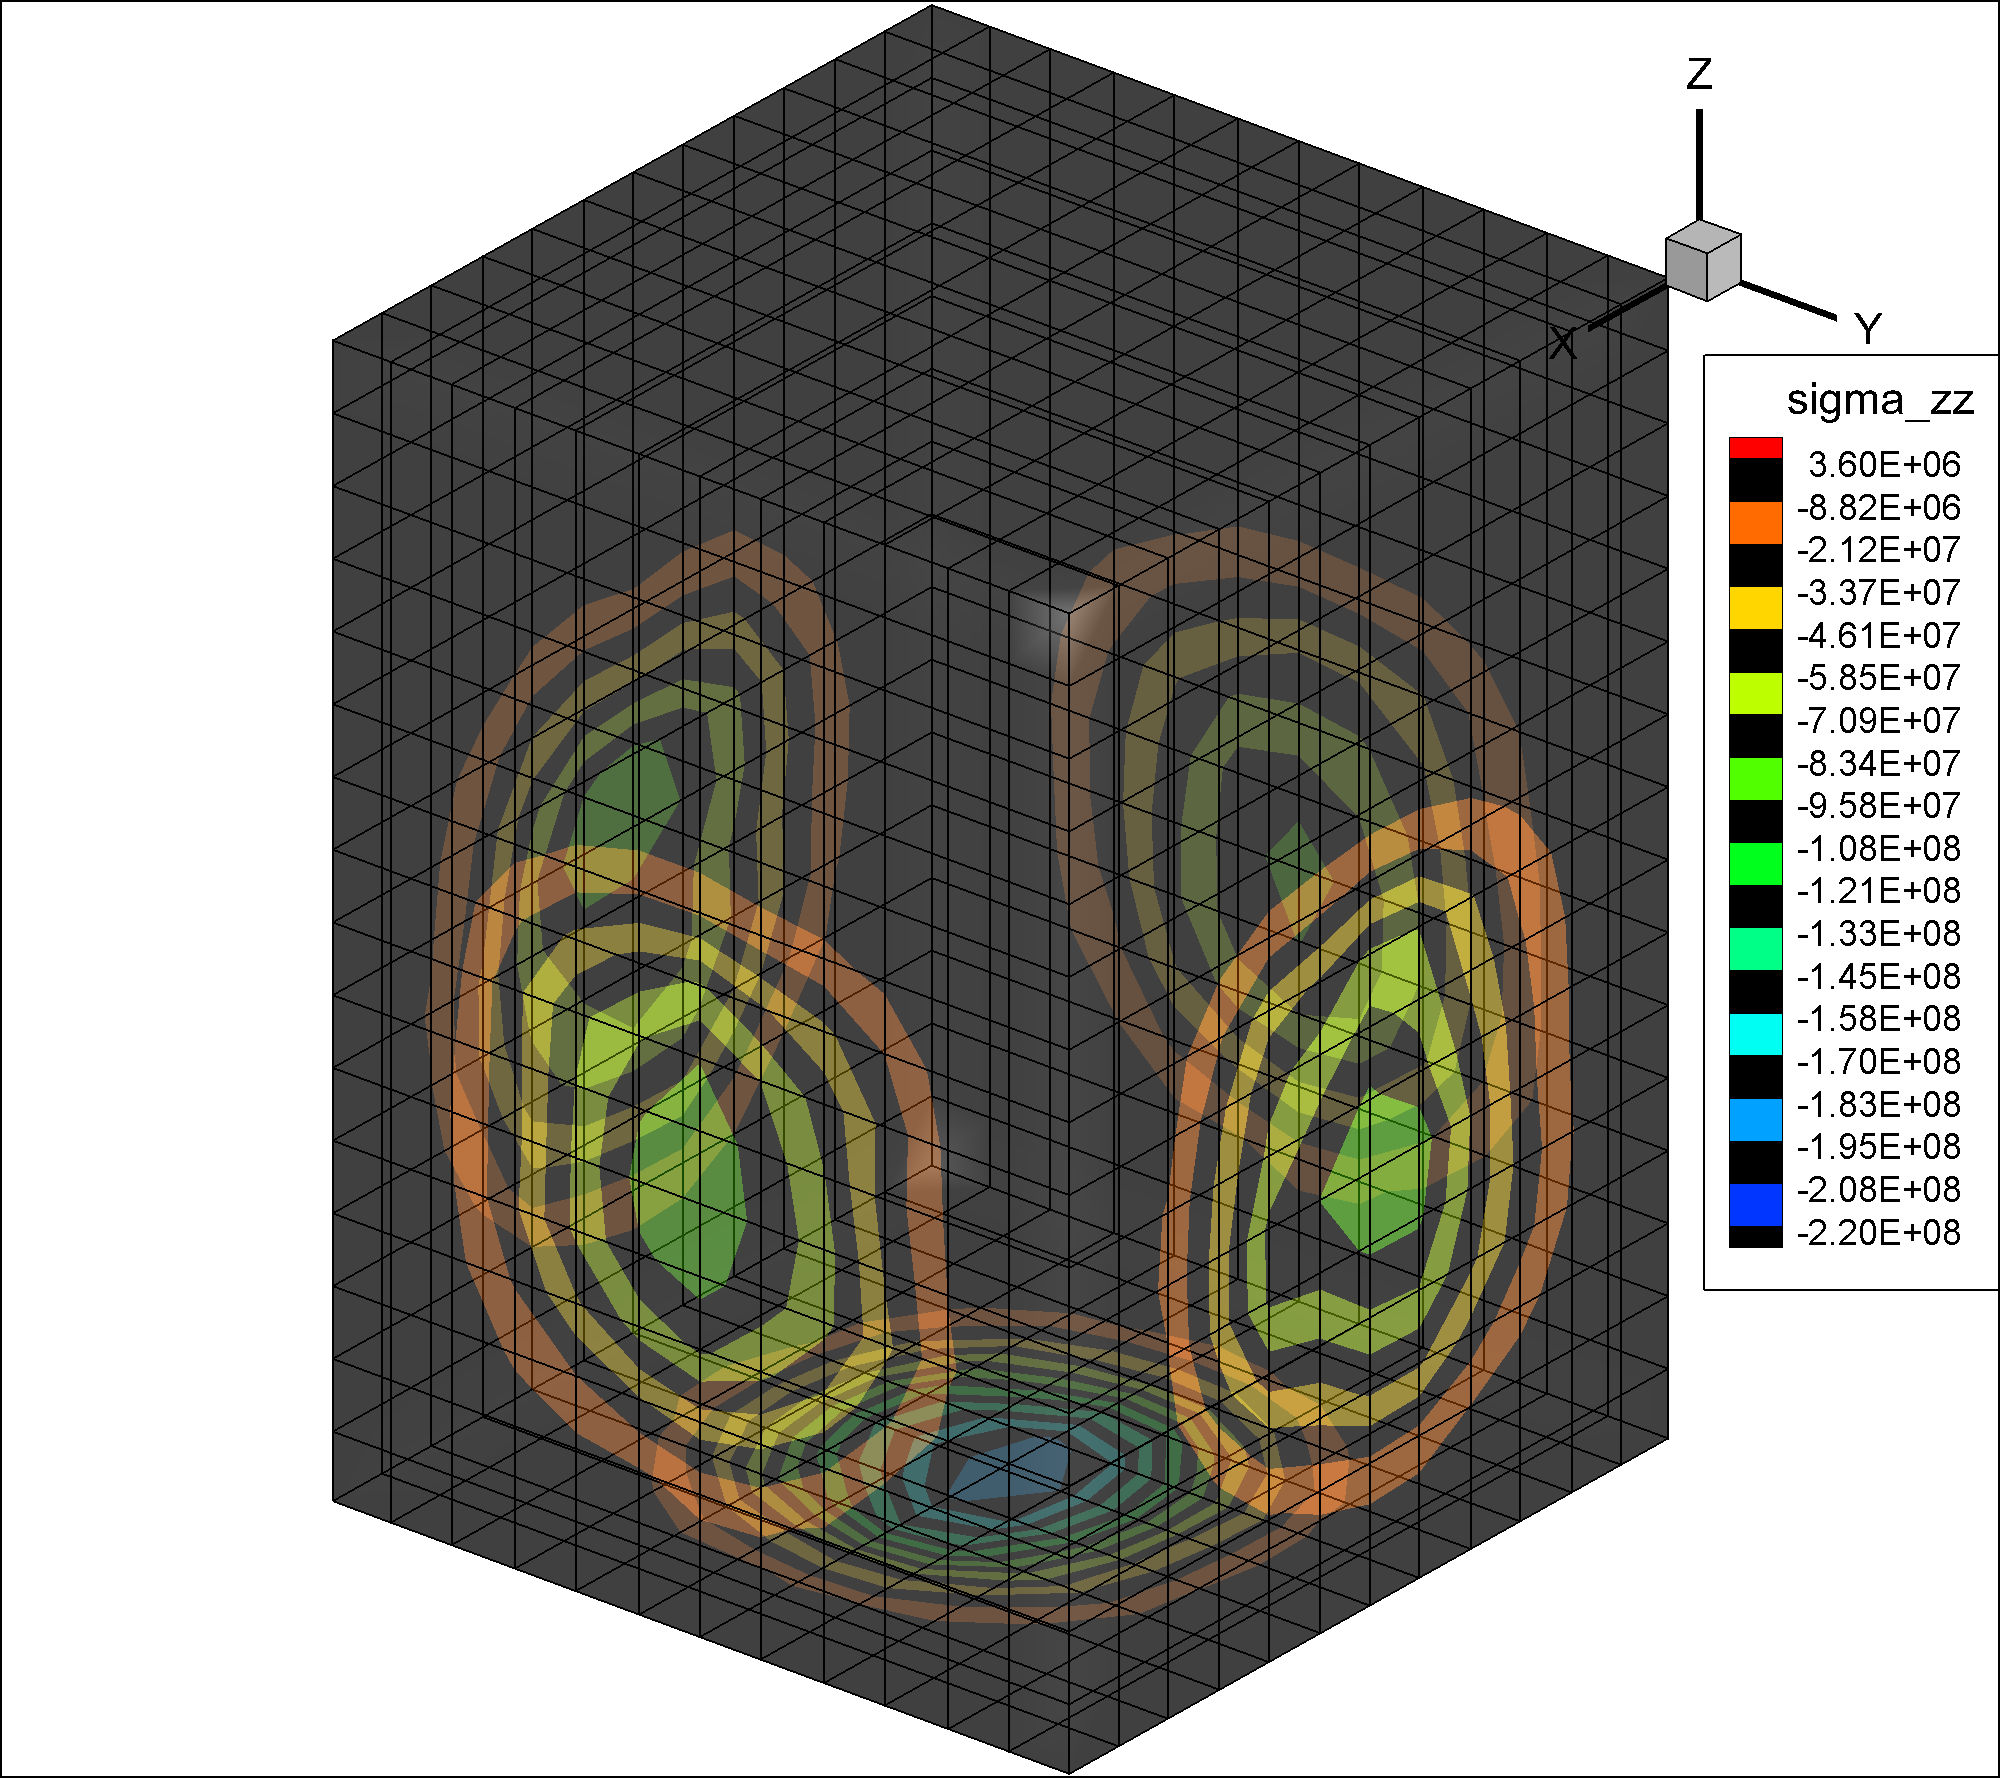
Step 0. See attached couple\_stress\_plot\_045\_notime.dat (compressed in .rar format) and the corresponding tecplot.png. The data are in Tecplot FEBRICK (finite element brick) format , each cell/brick containing 8 vertex nodes. Tecplot seems to be able to use the finite element shape function for arbitrary interpolation, for example, the number of contours can be increased without difficulty.
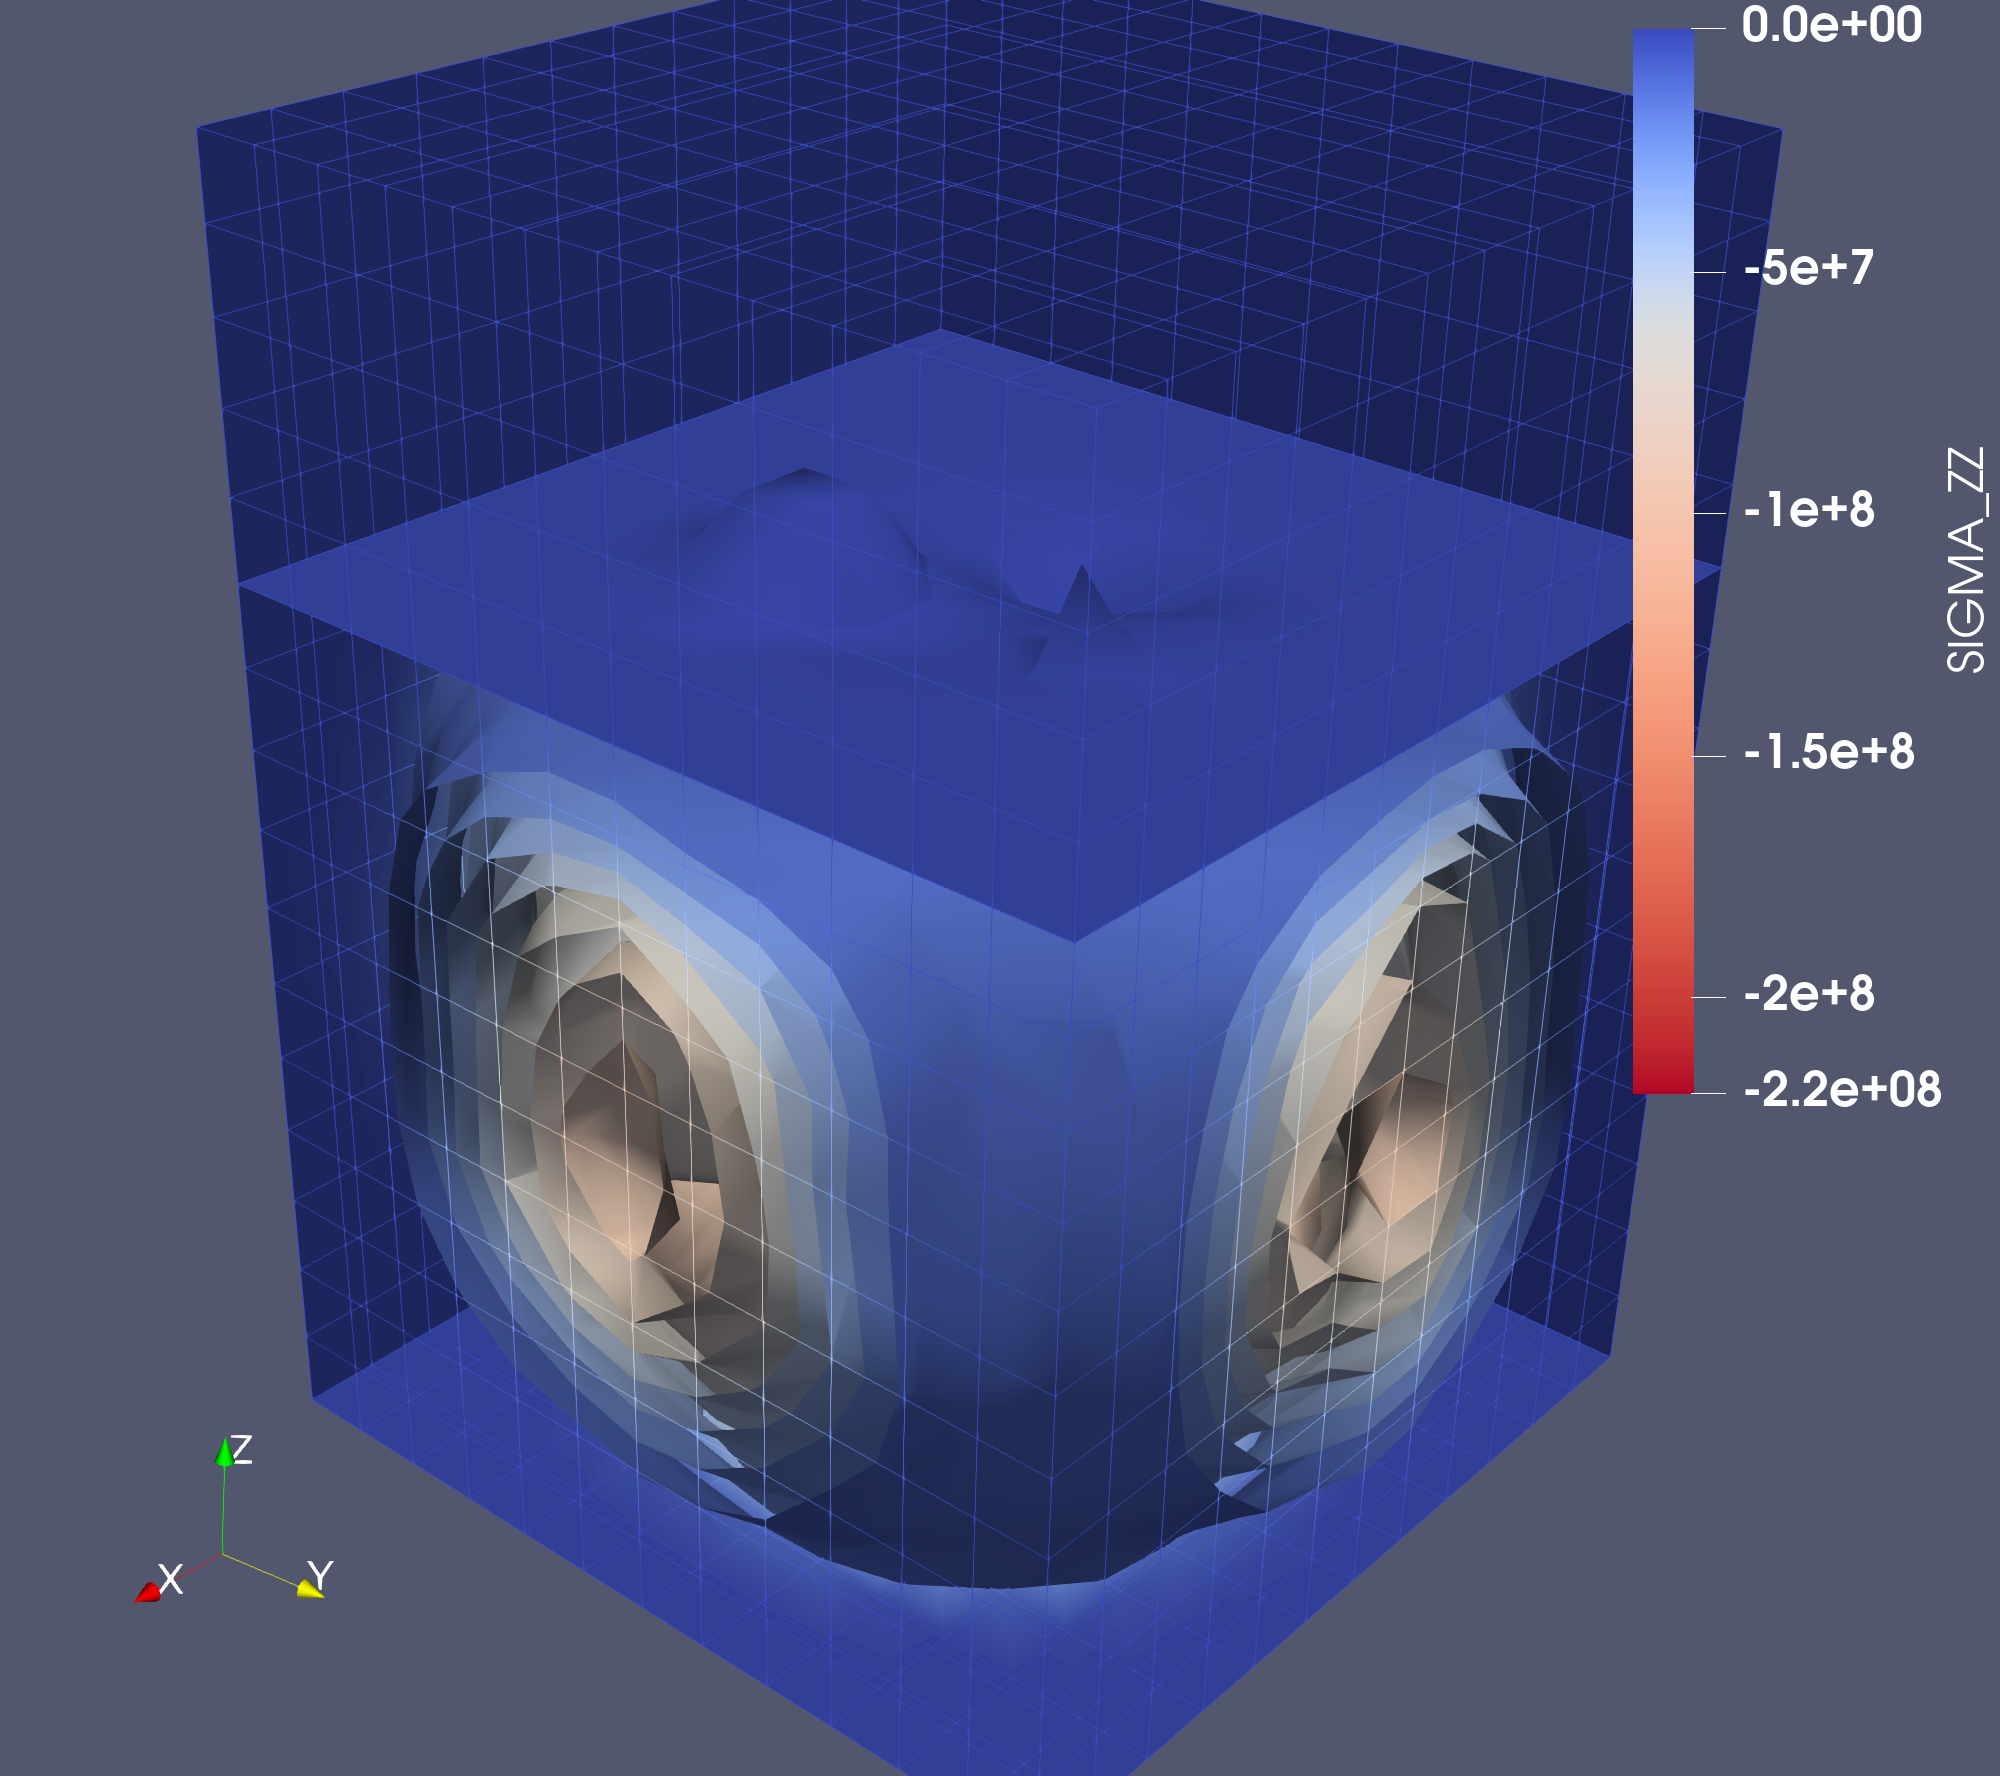
Step 1. Paraview 5.8 can open this couple\_stress\_plot\_045\_notime.dat using Tecplot Reader. It displays pv1.png with the following options:
check sigma\_zz only
wireframe
coloring: sigma\_zz
backface representation: surface
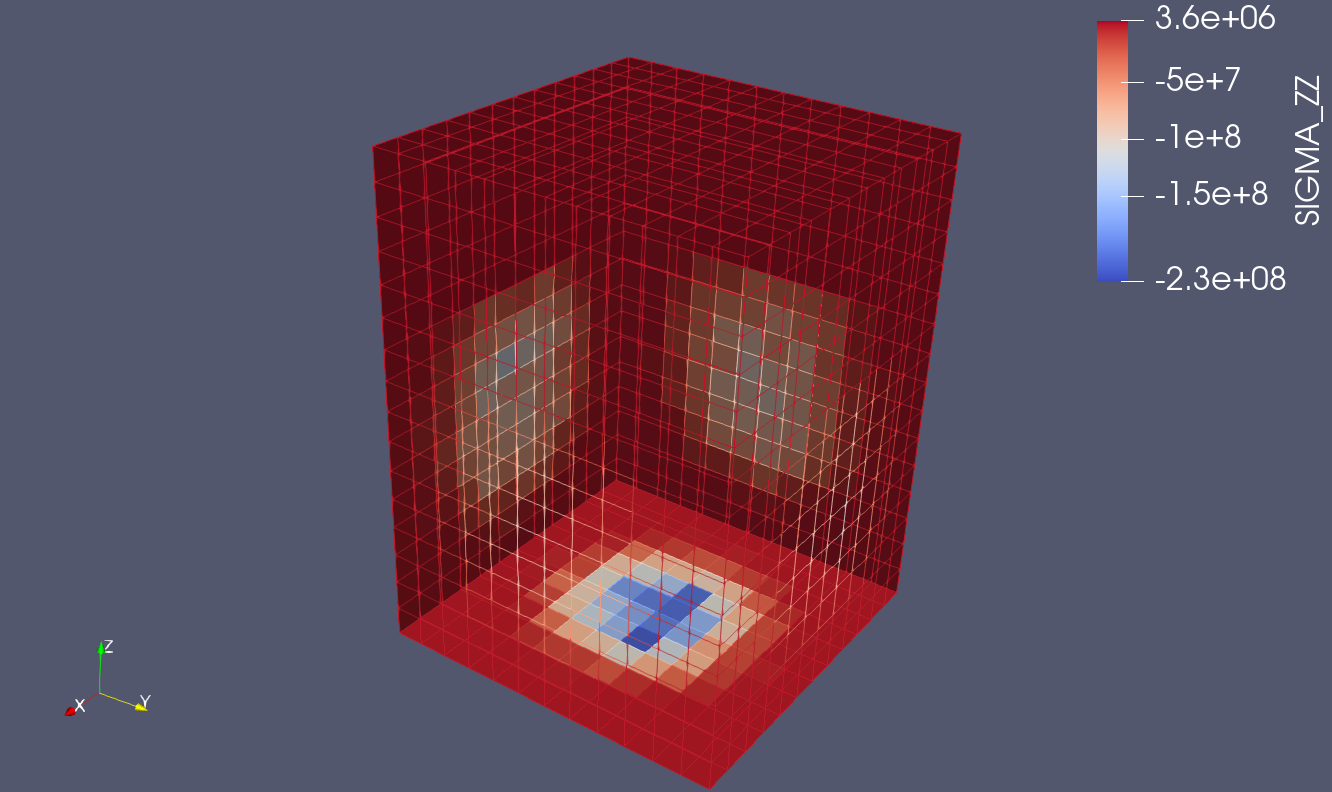
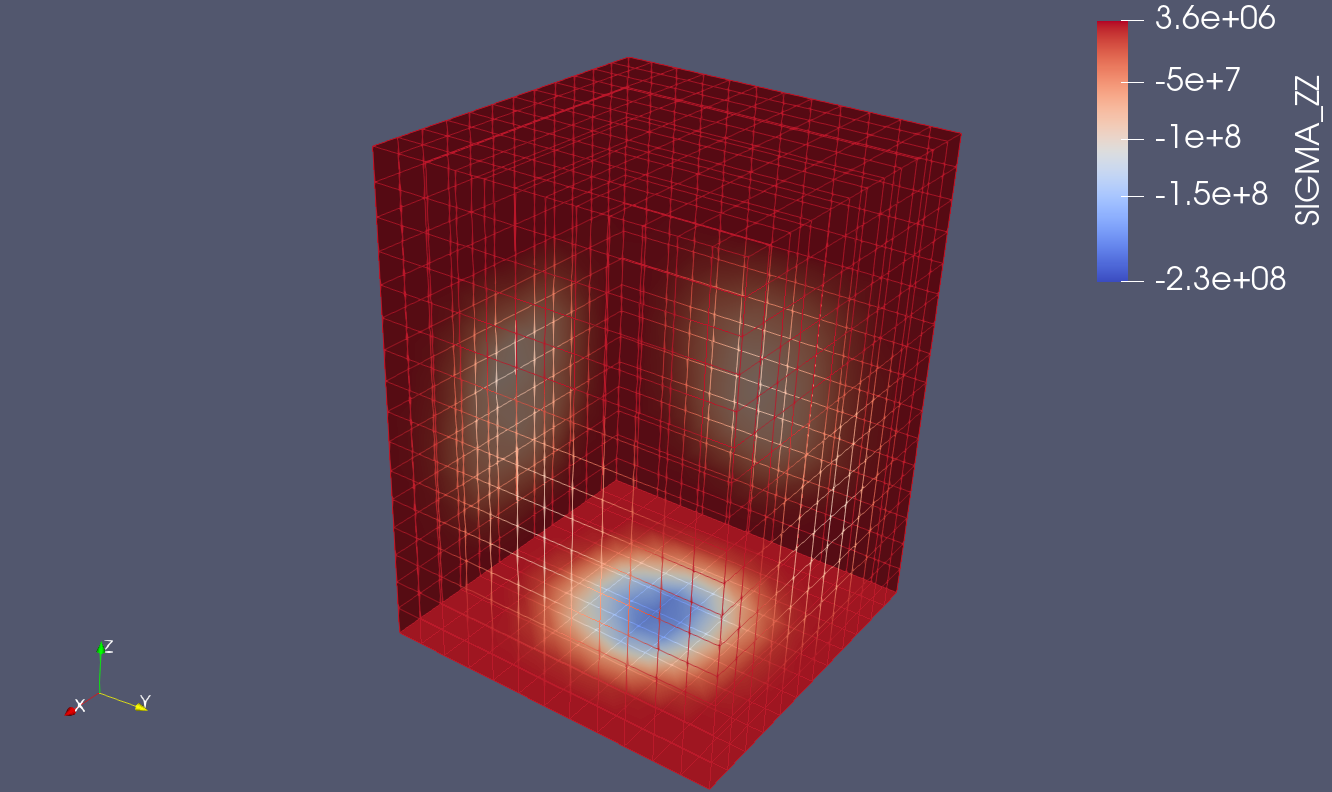
Step 2. I tried the “Cell data to point data” filter, it display pv2.png with the following options:
wireframe
coloring: sigma\_zz
backface representation: surface
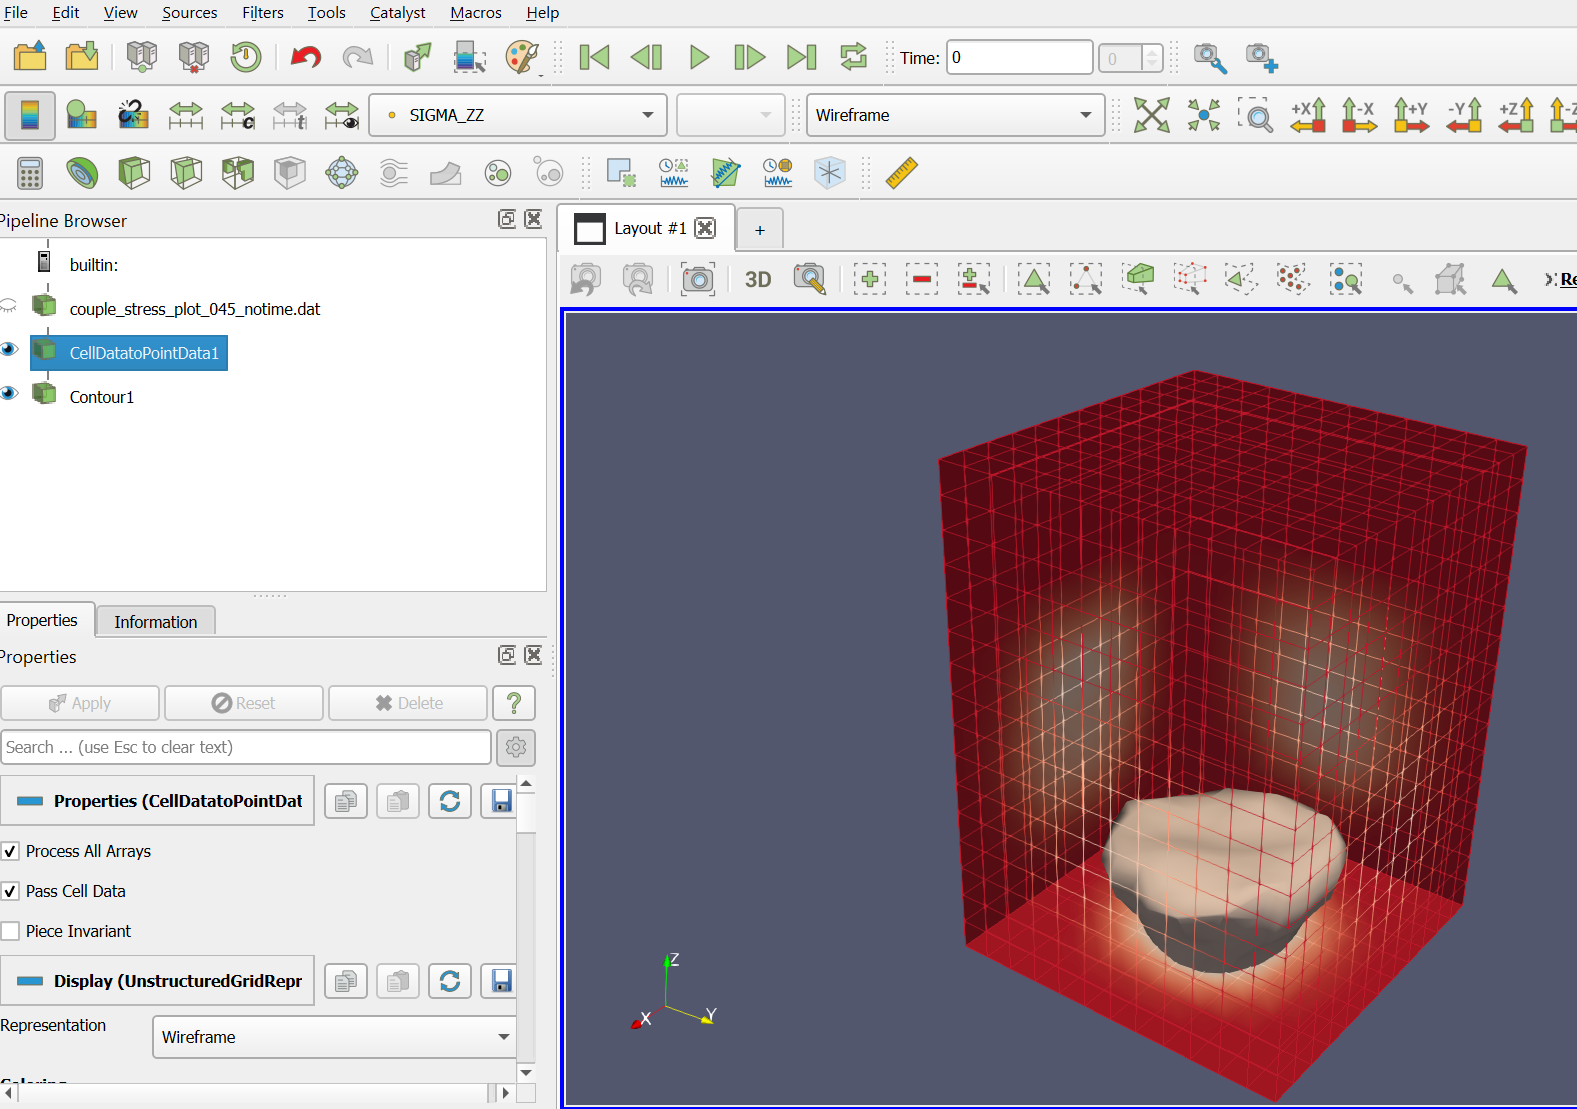
Step 3. I tried Contour and it displays pv3.png, still cannot plot contour along the cube sides and bottom like Tecplot
My questions are:
1. is there a general method or filter to contour Tecplot FEBRICK data?
2. can it interpolate data arbitrarily?
3. can it plot the surface or near-surface contours like Tecplot?
Thank you for your suggestion.
Beichuan Yan
[couple\_stress\_plot\_045\_notime.rar](https://discourse.paraview.org/uploads/short-url/4o3W92qOfBnNswTKaPspVYziNdx.rar) (1005.0 KB)
 !
---
### Author:  [@yanb](https://discourse.paraview.org/u/yanb)
#### Post date: [April 13, 2020, 5:05am UTC](https://discourse.paraview.org/t/how-to-plot-contour-for-tecplot-febrick-data/4036/2 "2020-04-13T05:05:45Z")
Perhaps I figured it out, now Paraview can plot the same as Tecplot.