# How to plot flooding zeros data?
**URL:** https://discourse.paraview.org/t/how-to-plot-flooding-zeros-data/7875
**Category:** ParaView Support
**Created:** [August 27, 2021, 5:10am UTC](https://discourse.paraview.org/t/how-to-plot-flooding-zeros-data/7875 "2021-08-27T05:10:00Z")
**Posts on this page:** 2
**Page:** 1
### Author:  [@aquanaut](https://discourse.paraview.org/u/aquanaut)
#### Post date: [August 27, 2021, 5:10am UTC](https://discourse.paraview.org/t/how-to-plot-flooding-zeros-data/7875/1 "2021-08-27T05:10:00Z")
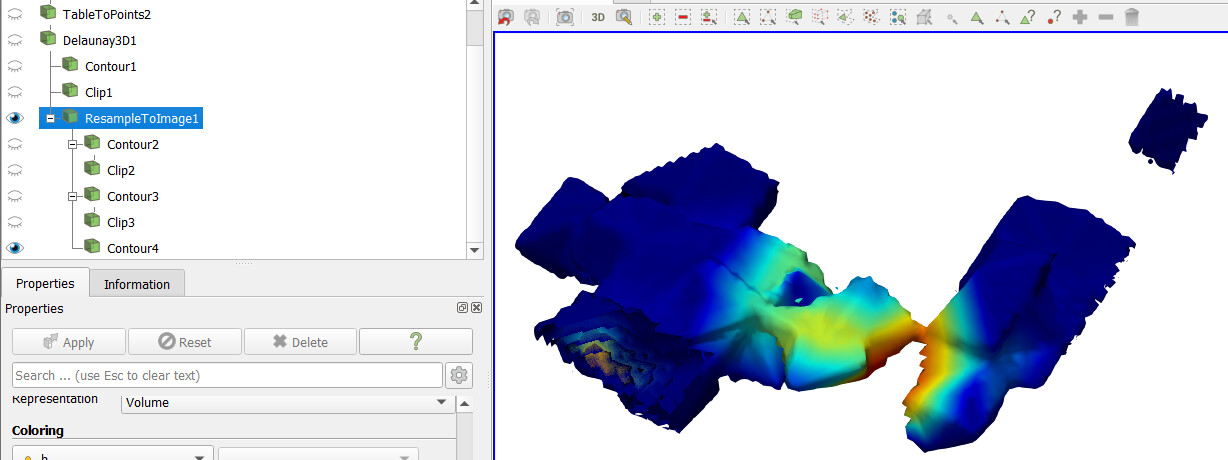
The sizes may be too large that the plot is so ugly.
How can plot these data to smooth the isosurface?
[data11.csv](https://discourse.paraview.org/uploads/short-url/pmPa234tW8M0U9XxK6oqXmEQ7Qn.csv) (2.1 KB)
[data22.csv](https://discourse.paraview.org/uploads/short-url/v6KYcfHU9tjmaeZAR9YnLuy4lDB.csv) (23.6 KB)

Thank you very much.
---
### Author:  [@Kenichiro-Yoshimi](https://discourse.paraview.org/u/Kenichiro-Yoshimi)
#### Post date: [August 28, 2021, 9:06am UTC](https://discourse.paraview.org/t/how-to-plot-flooding-zeros-data/7875/2 "2021-08-28T09:06:06Z")
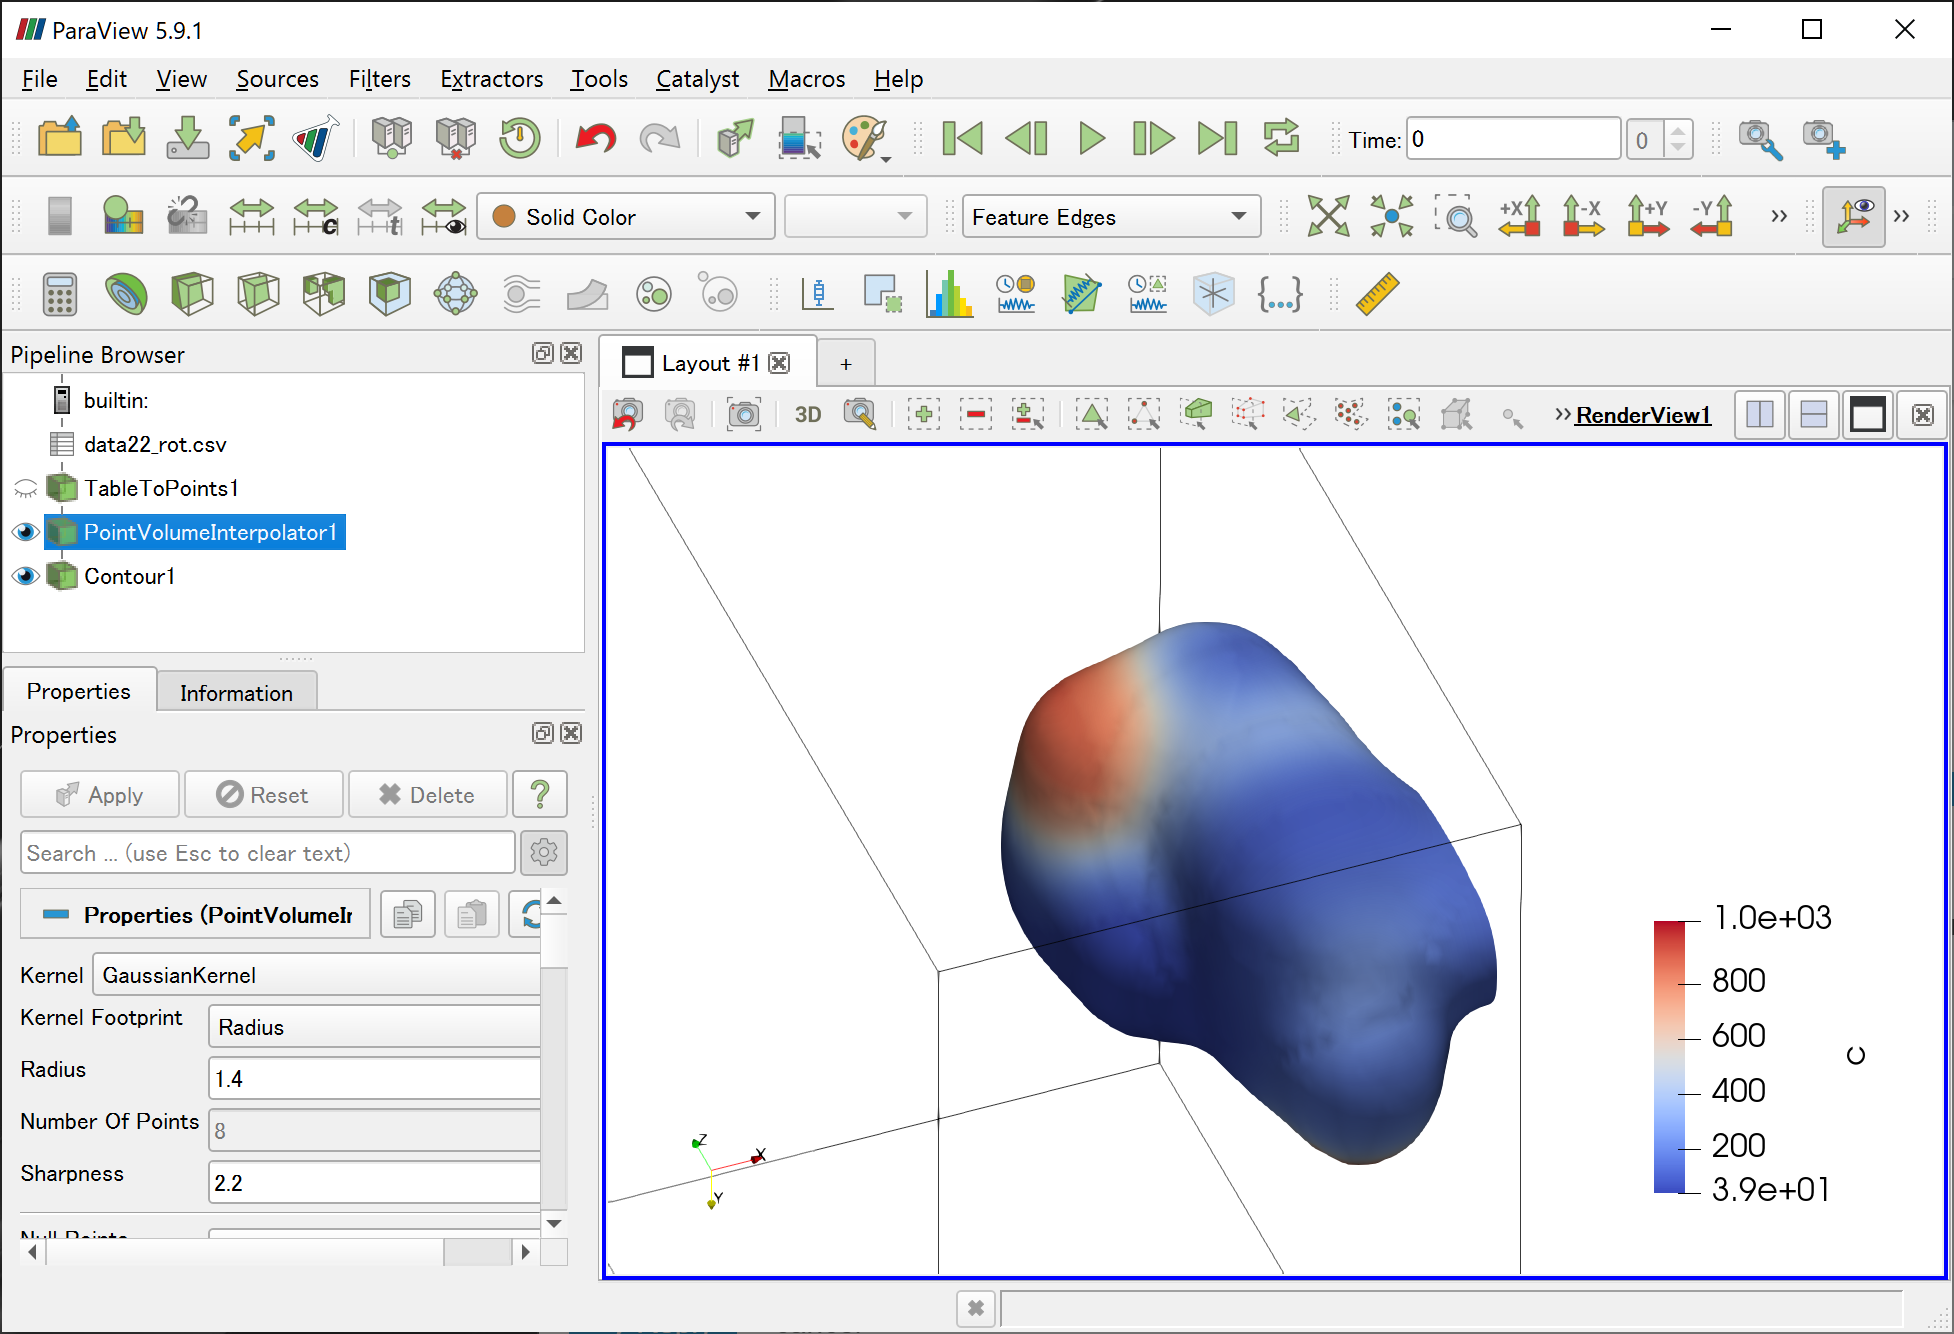
After rotating the region of the point cloud along the x, y, and z axes, you may be able to use the **Point Volume Interpolator** filter so as to get a smoother isosurface.