# how to plot over line with the horizontal
**URL:** https://discourse.paraview.org/t/how-to-plot-over-line-with-the-horizontal/15866
**Category:** ParaView Support
**Created:** [December 14, 2024, 1:18pm UTC](https://discourse.paraview.org/t/how-to-plot-over-line-with-the-horizontal/15866 "2024-12-14T13:18:57Z")
**Posts on this page:** 8
**Page:** 1
### Author:  [@shenbei](https://discourse.paraview.org/u/shenbei)
#### Post date: [December 14, 2024, 1:18pm UTC](https://discourse.paraview.org/t/how-to-plot-over-line-with-the-horizontal/15866/1 "2024-12-14T13:18:57Z")
Hello everyone, I would like to ask, I have obtained the average data of a horizontal slice, and now I would like to obtain the variation of this data along the height. How should I proceed
---
### Author:  [@nicolas.vuaille](https://discourse.paraview.org/u/nicolas.vuaille)
#### Post date: [December 16, 2024, 8:58am UTC](https://discourse.paraview.org/t/how-to-plot-over-line-with-the-horizontal/15866/2 "2024-12-16T08:58:15Z")
Hi,
Did you try the `Plot Over Line` filter ?
---
### Author:  [@shenbei](https://discourse.paraview.org/u/shenbei)
#### Post date: [December 16, 2024, 9:00am UTC](https://discourse.paraview.org/t/how-to-plot-over-line-with-the-horizontal/15866/3 "2024-12-16T09:00:33Z")
Plot over line can only obtain data on one line, but I want to obtain data on the variation of a layer or surface with height.
---
### Author:  [@shenbei](https://discourse.paraview.org/u/shenbei)
#### Post date: [December 16, 2024, 9:01am UTC](https://discourse.paraview.org/t/how-to-plot-over-line-with-the-horizontal/15866/4 "2024-12-16T09:01:16Z")
Or rather, how did you operate it,thank you for your reply
---
### Author:  [@nicolas.vuaille](https://discourse.paraview.org/u/nicolas.vuaille)
#### Post date: [December 16, 2024, 9:13am UTC](https://discourse.paraview.org/t/how-to-plot-over-line-with-the-horizontal/15866/5 "2024-12-16T09:13:22Z")
Not sure to follow. Do you mean: you slice at several positions, compute the mean on each slice and then try to get the diff between slices ?
If not can you share some detailed steps, and possibly data / screenshot ?
---
### Author:  [@shenbei](https://discourse.paraview.org/u/shenbei)
#### Post date: [December 16, 2024, 9:21am UTC](https://discourse.paraview.org/t/how-to-plot-over-line-with-the-horizontal/15866/6 "2024-12-16T09:21:06Z")
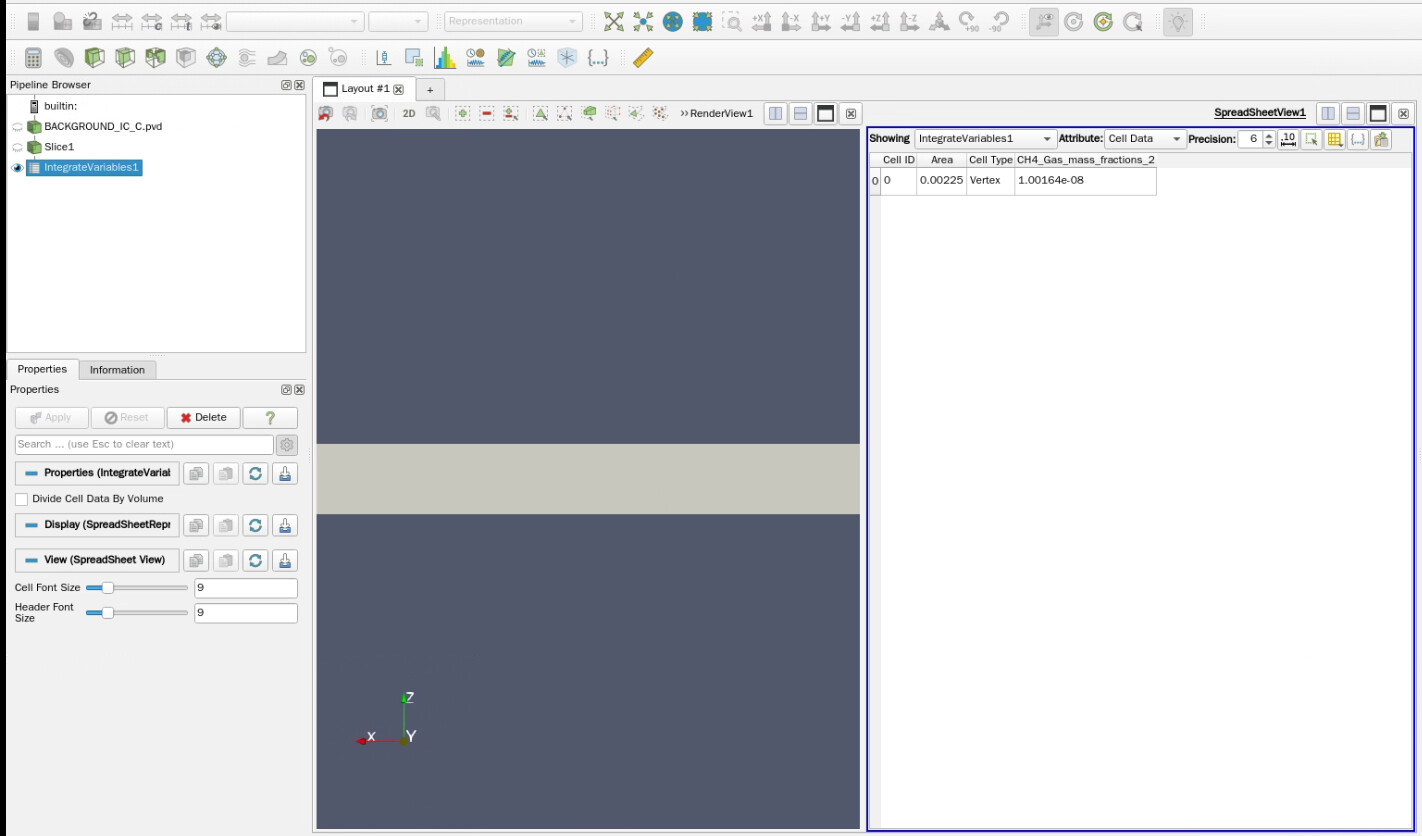
Yes, it’s like this, but it’s very difficult to manually select a few slices of different heights, and if I want to get the average value of slices changing with height, I have to select 300 slices of different heights. So, it’s very difficult. Is there any simple method
---
### Author:  [@nicolas.vuaille](https://discourse.paraview.org/u/nicolas.vuaille)
#### Post date: [December 16, 2024, 9:46am UTC](https://discourse.paraview.org/t/how-to-plot-over-line-with-the-horizontal/15866/7 "2024-12-16T09:46:59Z")
Not sure how to do that. Two ideas to explore:
- `GenerateTimeSteps` on your data, move the slice (create an animation) and then `PlotDataOverTime`
- Create a multi-slice with `Slice` and a value-range. Do some python code with `Programmable Filter` (can use a `Connectivity` to identify each slice).
---
### Author:  [@shenbei](https://discourse.paraview.org/u/shenbei)
#### Post date: [December 16, 2024, 11:26am UTC](https://discourse.paraview.org/t/how-to-plot-over-line-with-the-horizontal/15866/8 "2024-12-16T11:26:18Z")
Thank you for your reply. I will study the two methods you mentioned