# How to plot time series at a fixed point for SPH simulation (.vtu) in ParaView
**URL:** https://discourse.paraview.org/t/how-to-plot-time-series-at-a-fixed-point-for-sph-simulation-vtu-in-paraview/16565
**Category:** ParaView Support
**Tags:** vtk
**Created:** [May 4, 2025, 6:29pm UTC](https://discourse.paraview.org/t/how-to-plot-time-series-at-a-fixed-point-for-sph-simulation-vtu-in-paraview/16565 "2025-05-04T18:29:12Z")
**Posts on this page:** 11
**Page:** 1
### Author:  [@Nour\_Touil](https://discourse.paraview.org/u/Nour_Touil)
#### Post date: [May 4, 2025, 6:29pm UTC](https://discourse.paraview.org/t/how-to-plot-time-series-at-a-fixed-point-for-sph-simulation-vtu-in-paraview/16565/1 "2025-05-04T18:29:12Z")
Hi,
I’m visualizing an SPH simulation in ParaView using `.vtu` files with multiple time steps.
I would like to plot the time evolution of a variable ( like pressure or Z-variation because it’s a fluid simulation) at a fixed spatial point.
I tried using `Probe Location` and `Plot Data Over Time`, but I only get constant or zero values.
What is the best way to extract interpolated time series data at a given point in SPH simulations?
thank you in advance .
---
### Author:  [@mwestphal](https://discourse.paraview.org/u/mwestphal)
#### Post date: [May 5, 2025, 8:46am UTC](https://discourse.paraview.org/t/how-to-plot-time-series-at-a-fixed-point-for-sph-simulation-vtu-in-paraview/16565/2 "2025-05-05T08:46:52Z")
Please share your data.
---
### Author:  [@Nour\_Touil](https://discourse.paraview.org/u/Nour_Touil)
#### Post date: [May 5, 2025, 9:03am UTC](https://discourse.paraview.org/t/how-to-plot-time-series-at-a-fixed-point-for-sph-simulation-vtu-in-paraview/16565/3 "2025-05-05T09:03:12Z")
i shared the .pvd files ( i think they are the same as the .vtu files )
> **(attachments)**
>
> [boundary\_1.pvd](https://discourse.paraview.org/uploads/short-url/2vMzyEfcfahNemRI6xM0x8bQOl0.pvd) (33.2 KB)
> [fluid\_1.pvd](https://discourse.paraview.org/uploads/short-url/eXvliheRiRvavt2l9vFQ93pse8h.pvd) (31.7 KB)
---
### Author:  [@mwestphal](https://discourse.paraview.org/u/mwestphal)
#### Post date: [May 5, 2025, 9:35am UTC](https://discourse.paraview.org/t/how-to-plot-time-series-at-a-fixed-point-for-sph-simulation-vtu-in-paraview/16565/4 "2025-05-05T09:35:22Z")
You need to share the .vtu files too.
---
### Author:  [@Nour\_Touil](https://discourse.paraview.org/u/Nour_Touil)
#### Post date: [May 6, 2025, 8:11am UTC](https://discourse.paraview.org/t/how-to-plot-time-series-at-a-fixed-point-for-sph-simulation-vtu-in-paraview/16565/5 "2025-05-06T08:11:23Z")
here i shared the .vtu files ( SPH files took a lot of time to be imported so i shared another files with the same prob)
> **[Google Drive: Sign-in](https://accounts.google.com/v3/signin/identifier?continue=https%3A%2F%2Fdrive.google.com%2Fdrive%2Ffolders%2F1IHZjdNilIUv8sivpSTItXyUhq_RW6f-E%3Fusp%3Ddrive_link&followup=https%3A%2F%2Fdrive.google.com%2Fdrive%2Ffolders%2F1IHZjdNilIUv8sivpSTItXyUhq_RW6f-E%3Fusp%3Ddrive_link&ifkv=ASKV5Mhbkhs3_rOwTlVqv2XFdlUqQsz57fG-yFRB2bicwH7Zf2D5QbCIgQ6URwrZsTFqvwkRnhUGZQ&osid=1&passive=1209600&service=wise&flowName=GlifWebSignIn&flowEntry=ServiceLogin&dsh=S1882582970%3A1746518780920860)**
>
> Access Google Drive with a Google account (for personal use) or Google Workspace account (for business use).
---
### Author:  [@mwestphal](https://discourse.paraview.org/u/mwestphal)
#### Post date: [May 6, 2025, 9:31am UTC](https://discourse.paraview.org/t/how-to-plot-time-series-at-a-fixed-point-for-sph-simulation-vtu-in-paraview/16565/6 "2025-05-06T09:31:44Z")
You need to provide access to the file
---
### Author:  [@Nour\_Touil](https://discourse.paraview.org/u/Nour_Touil)
#### Post date: [May 6, 2025, 9:43am UTC](https://discourse.paraview.org/t/how-to-plot-time-series-at-a-fixed-point-for-sph-simulation-vtu-in-paraview/16565/7 "2025-05-06T09:43:36Z")
sorry
[https://drive.google.com/drive/folders/1IHZjdNilIUv8sivpSTItXyUhq\_RW6f-E?usp=sharing](https://drive.google.com/drive/folders/1IHZjdNilIUv8sivpSTItXyUhq_RW6f-E?usp=sharing)
---
### Author:  [@mwestphal](https://discourse.paraview.org/u/mwestphal)
#### Post date: [May 6, 2025, 9:54am UTC](https://discourse.paraview.org/t/how-to-plot-time-series-at-a-fixed-point-for-sph-simulation-vtu-in-paraview/16565/8 "2025-05-06T09:54:44Z")
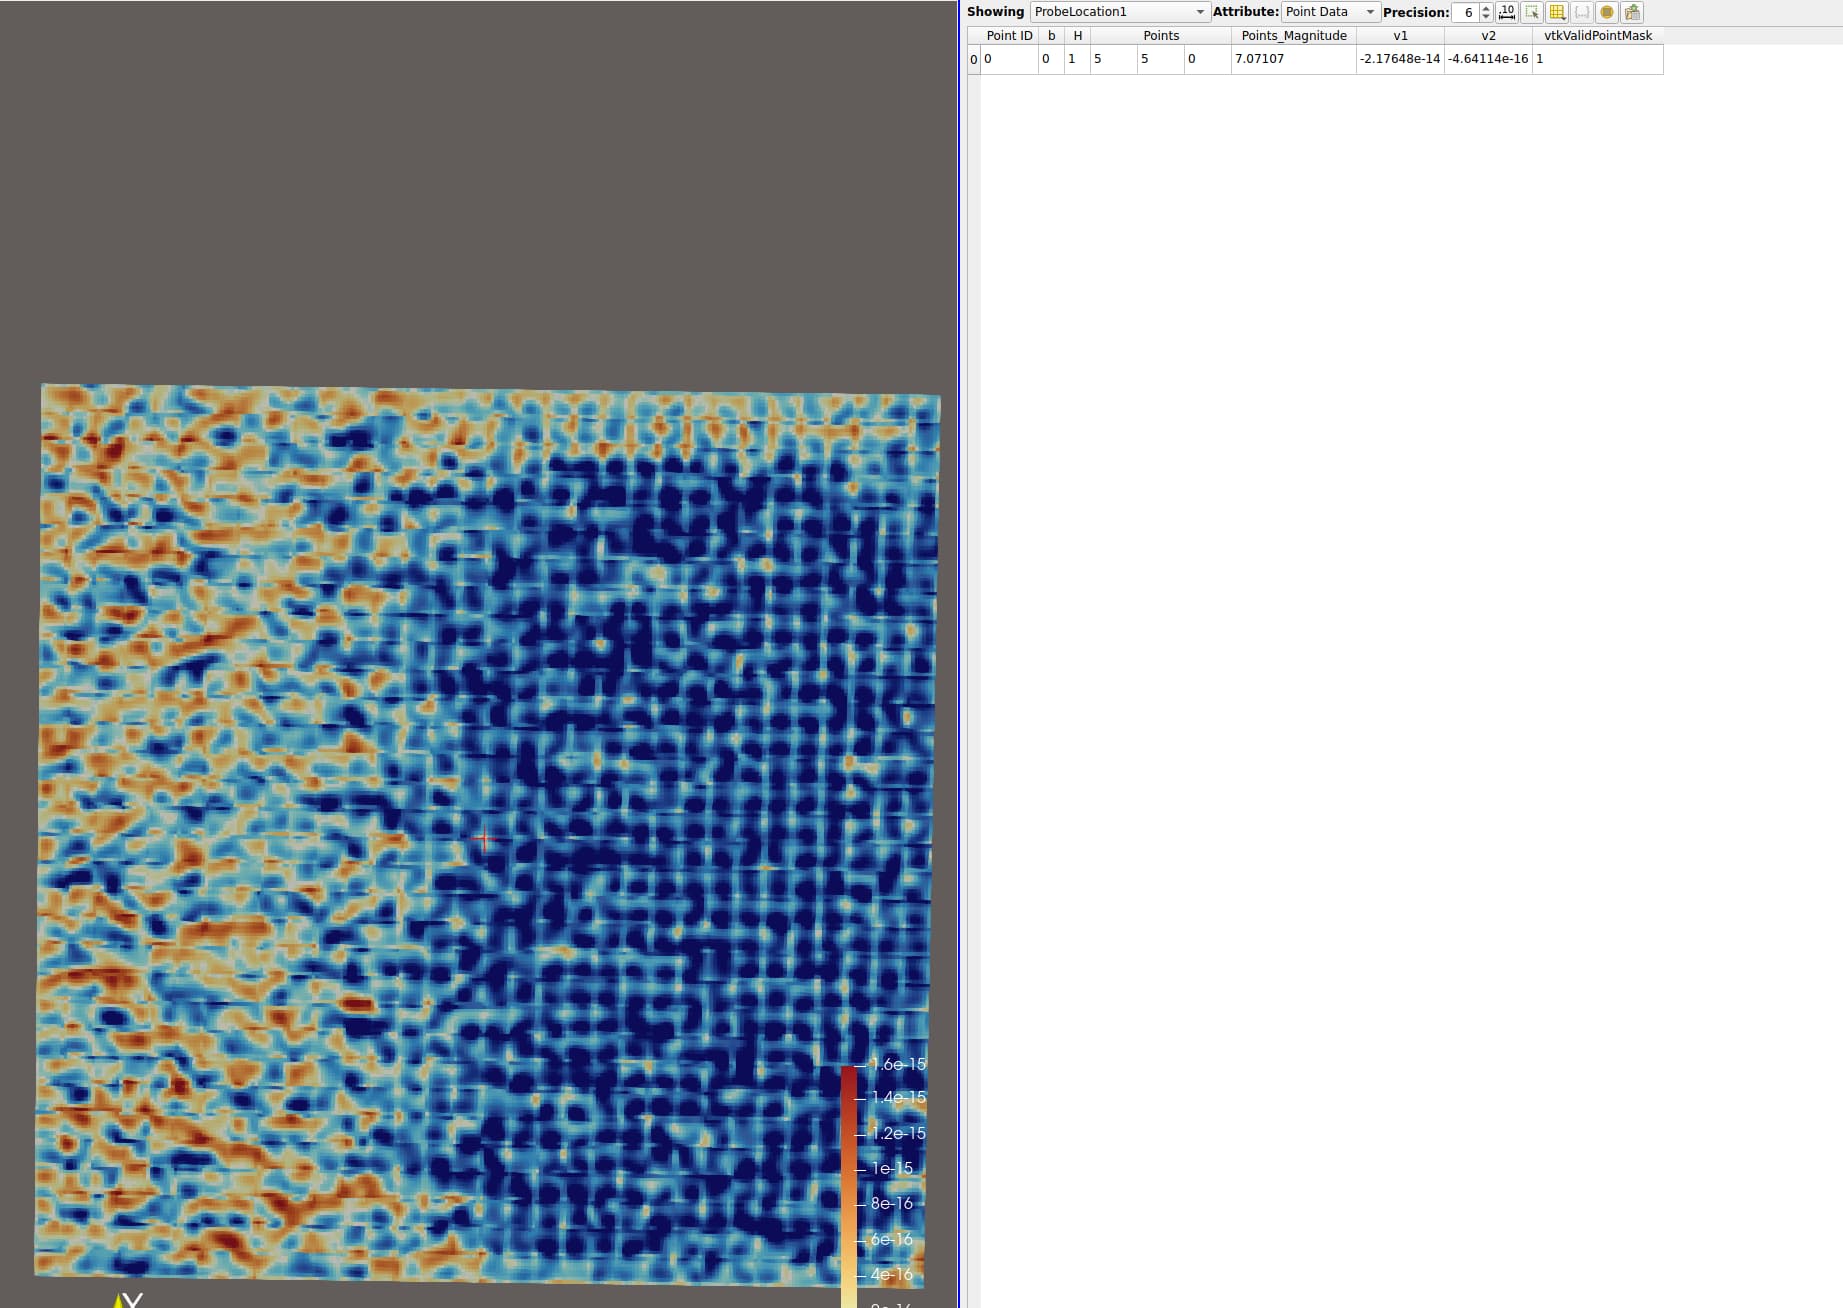
Works fine here, which version of ParaView are you using ?
---
### Author:  [@Nour\_Touil](https://discourse.paraview.org/u/Nour_Touil)
#### Post date: [May 6, 2025, 10:04am UTC](https://discourse.paraview.org/t/how-to-plot-time-series-at-a-fixed-point-for-sph-simulation-vtu-in-paraview/16565/9 "2025-05-06T10:04:53Z")
version 5.13.3
Now I’m not sure if I used the filters properly , from the résults you got , is it possible to plot a simple graph of ‘H’ over the time in specific distance ?
---
### Author:  [@mwestphal](https://discourse.paraview.org/u/mwestphal)
#### Post date: [May 6, 2025, 10:11am UTC](https://discourse.paraview.org/t/how-to-plot-time-series-at-a-fixed-point-for-sph-simulation-vtu-in-paraview/16565/10 "2025-05-06T10:11:15Z")
Sure:
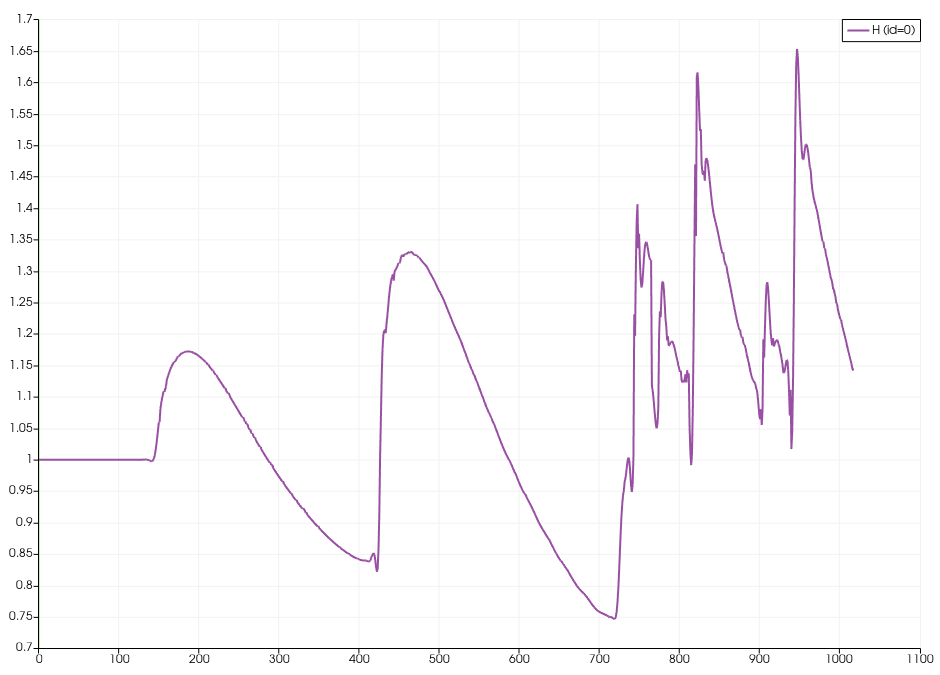
ProbeLocation + PlotDataOverTime
Here is a state file:
[hplot.pvsm](https://discourse.paraview.org/uploads/short-url/49QgOZCkrLEUMLk3Qpn32iXSWMx.pvsm) (437.6 KB)
---
### Author:  [@Nour\_Touil](https://discourse.paraview.org/u/Nour_Touil)
#### Post date: [May 7, 2025, 4:49pm UTC](https://discourse.paraview.org/t/how-to-plot-time-series-at-a-fixed-point-for-sph-simulation-vtu-in-paraview/16565/11 "2025-05-07T16:49:38Z")
it’s working now , thank you