# How to plot total force and displacement over timesteps?
**URL:** https://discourse.paraview.org/t/how-to-plot-total-force-and-displacement-over-timesteps/15707
**Category:** ParaView Support
**Created:** [November 10, 2024, 2:27pm UTC](https://discourse.paraview.org/t/how-to-plot-total-force-and-displacement-over-timesteps/15707 "2024-11-10T14:27:58Z")
**Posts on this page:** 11
**Page:** 1
### Author:  [@K\_Zurawski](https://discourse.paraview.org/u/K_Zurawski)
#### Post date: [November 10, 2024, 2:27pm UTC](https://discourse.paraview.org/t/how-to-plot-total-force-and-displacement-over-timesteps/15707/1 "2024-11-10T14:27:58Z")
Hi.
I run a nonlinear simulation and would like to plot displacement of chosen node on X axis and applied load on Y axis. The applied load is 0 for step 0 nad max for last step. I have 10 time steps. Just need to plot a curve. Could someone help me with that?
---
### Author:  [@nicolas.vuaille](https://discourse.paraview.org/u/nicolas.vuaille)
#### Post date: [November 12, 2024, 10:14am UTC](https://discourse.paraview.org/t/how-to-plot-total-force-and-displacement-over-timesteps/15707/2 "2024-11-12T10:14:46Z")
You should probably try `Plot Selection Over Time`. First select your point of interest, then apply the filter
---
### Author:  [@K\_Zurawski](https://discourse.paraview.org/u/K_Zurawski)
#### Post date: [November 13, 2024, 8:20am UTC](https://discourse.paraview.org/t/how-to-plot-total-force-and-displacement-over-timesteps/15707/3 "2024-11-13T08:20:19Z")
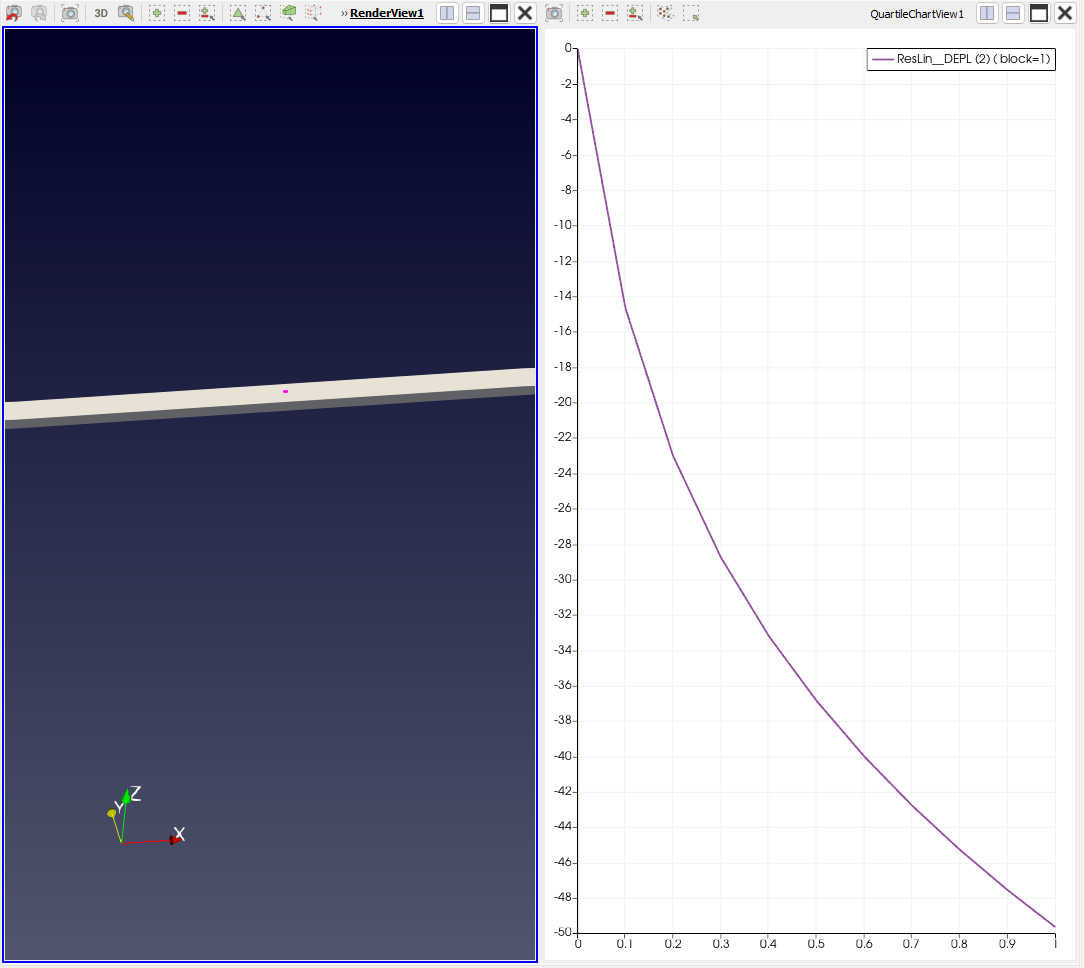
Thank you for your support. This gives me only chosen value (DX displacement over timestep) What I need is force - displacement curve (F - DX), but values of F and DX depend on timestep, load and displacement changes over timestep.
This is what I get when i plot selection over time:
And this is what I want to plot:
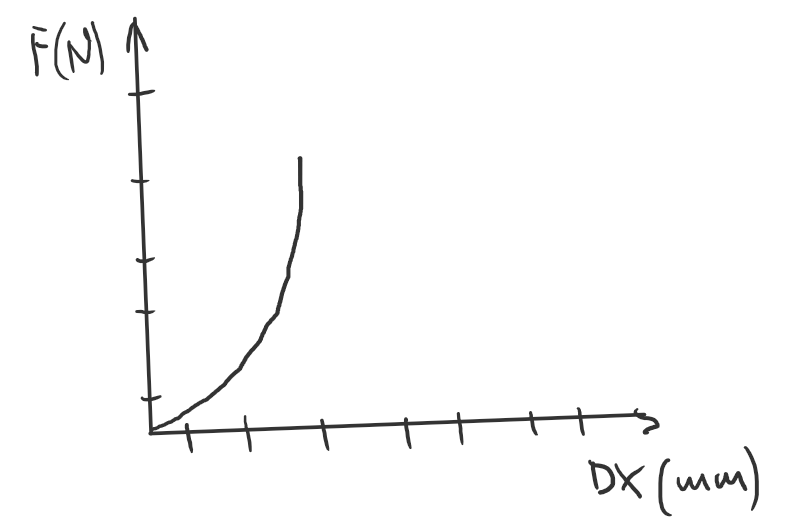
How I imagine it should be done is to sum forces applied to selected nodes to have a total load and put it in one column (like in Excel), where every cell is sum from time step. Then in second column I’d have to put chosen displacement according to time step as well. Then If I have those two columns, I could plot them in form of simple curve. I know how to do it in Excel manually, but I believe this trivial task can be easily tackled by such powerful postprocessor as Paraview. I just don’t know where to click.
---
### Author:  [@nicolas.vuaille](https://discourse.paraview.org/u/nicolas.vuaille)
#### Post date: [November 13, 2024, 8:28am UTC](https://discourse.paraview.org/t/how-to-plot-total-force-and-displacement-over-timesteps/15707/4 "2024-11-13T08:28:30Z")
You can configure your chart from the `Properties Panel` under the `Display` section, where you can choose `X array name`
Also for more about plots:
[https://docs.paraview.org/en/latest/UsersGuide/displayingData.html#line-chart-view](https://docs.paraview.org/en/latest/UsersGuide/displayingData.html#line-chart-view)
---
### Author:  [@K\_Zurawski](https://discourse.paraview.org/u/K_Zurawski)
#### Post date: [November 13, 2024, 8:53am UTC](https://discourse.paraview.org/t/how-to-plot-total-force-and-displacement-over-timesteps/15707/5 "2024-11-13T08:53:57Z")
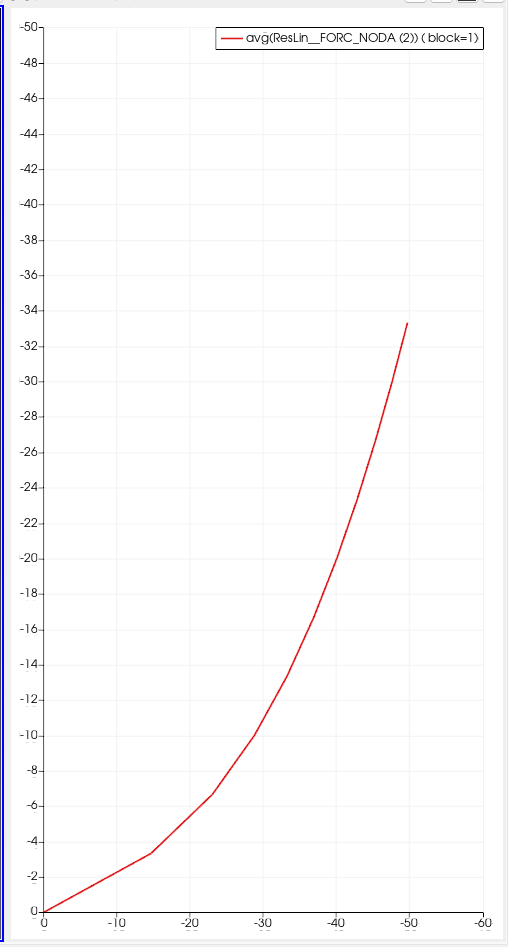
Thank you. I used Plot Data filter and it seems I’m getting the required information. Displacement is correct for chosen node. I’m using Code\_Aster and unfortunately FORC\_NODA shows all the reactions and forces applied. I need to extract forces applied only. I have 10kN applied in -Z direction over 2m. So in total there should be 20kN, I’m getting on the plot ~34kN.
---
### Author:  [@nicolas.vuaille](https://discourse.paraview.org/u/nicolas.vuaille)
#### Post date: [November 13, 2024, 8:57am UTC](https://discourse.paraview.org/t/how-to-plot-total-force-and-displacement-over-timesteps/15707/6 "2024-11-13T08:57:00Z")
Sorry, I don’t get what is your issue now.
What is the wrong element in the screenshot ? What do you expect instead ?
---
### Author:  [@K\_Zurawski](https://discourse.paraview.org/u/K_Zurawski)
#### Post date: [November 13, 2024, 9:01am UTC](https://discourse.paraview.org/t/how-to-plot-total-force-and-displacement-over-timesteps/15707/7 "2024-11-13T09:01:30Z")
For max displacement total force should be 20kN, this is max applied in the system. I’m getting more. Is it possible to subtract form FORCE\_NODA all reactions REAC\_NODA and the result plot on Y axis?
---
### Author:  [@K\_Zurawski](https://discourse.paraview.org/u/K_Zurawski)
#### Post date: [November 13, 2024, 9:09am UTC](https://discourse.paraview.org/t/how-to-plot-total-force-and-displacement-over-timesteps/15707/8 "2024-11-13T09:09:13Z")
In most of the FEA software you may get two results - applied forces and reactions of the system. In Code Aster this is different unfortunately, because FORCE\_NODA extracts all the forces in the system, which are both types (applied forces and reactions). So to have correct plot I’d have to subtract reactions from forces and then I’ll probably get the applied forces.
Other way would be sum of applied forces to nodal/element group or saved selection in the viewport. But this actually creates another problem - how to pick thousand nodes across one line…
---
### Author:  [@nicolas.vuaille](https://discourse.paraview.org/u/nicolas.vuaille)
#### Post date: [November 13, 2024, 9:31am UTC](https://discourse.paraview.org/t/how-to-plot-total-force-and-displacement-over-timesteps/15707/9 "2024-11-13T09:31:13Z")
If you want to do some operation between different variables (“arrays” in PV world), you can use filters. Check the `Calculator` to compute some difference for instance
---
### Author:  [@K\_Zurawski](https://discourse.paraview.org/u/K_Zurawski)
#### Post date: [November 13, 2024, 8:58pm UTC](https://discourse.paraview.org/t/how-to-plot-total-force-and-displacement-over-timesteps/15707/10 "2024-11-13T20:58:53Z")
Thank you. I think I need to limit results to nodal group firs in Code\_Aster and then manipulate the data. Do you know where can I find examples on use filters, except tutorial files from Paraview site?
---
### Author:  [@nicolas.vuaille](https://discourse.paraview.org/u/nicolas.vuaille)
#### Post date: [November 15, 2024, 8:41am UTC](https://discourse.paraview.org/t/how-to-plot-total-force-and-displacement-over-timesteps/15707/11 "2024-11-15T08:41:48Z")
I do not have more resources, but using the mentioned doc and asking question here is often a good starting point.
If you want even more like professional support or training you can reach [https://www.kitware.com/contact/advanced-support/](https://www.kitware.com/contact/advanced-support/)