# How to read a vtk file and draw a line graph
**URL:** https://discourse.paraview.org/t/how-to-read-a-vtk-file-and-draw-a-line-graph/16671
**Category:** ParaView Support
**Created:** [May 20, 2025, 2:32pm UTC](https://discourse.paraview.org/t/how-to-read-a-vtk-file-and-draw-a-line-graph/16671 "2025-05-20T14:32:46Z")
**Posts on this page:** 7
**Page:** 1
### Author:  [@flipper](https://discourse.paraview.org/u/flipper)
#### Post date: [May 20, 2025, 2:32pm UTC](https://discourse.paraview.org/t/how-to-read-a-vtk-file-and-draw-a-line-graph/16671/1 "2025-05-20T14:32:46Z")
Excuse me. I want to call the c++ interface of paraview to complete all the following operations:
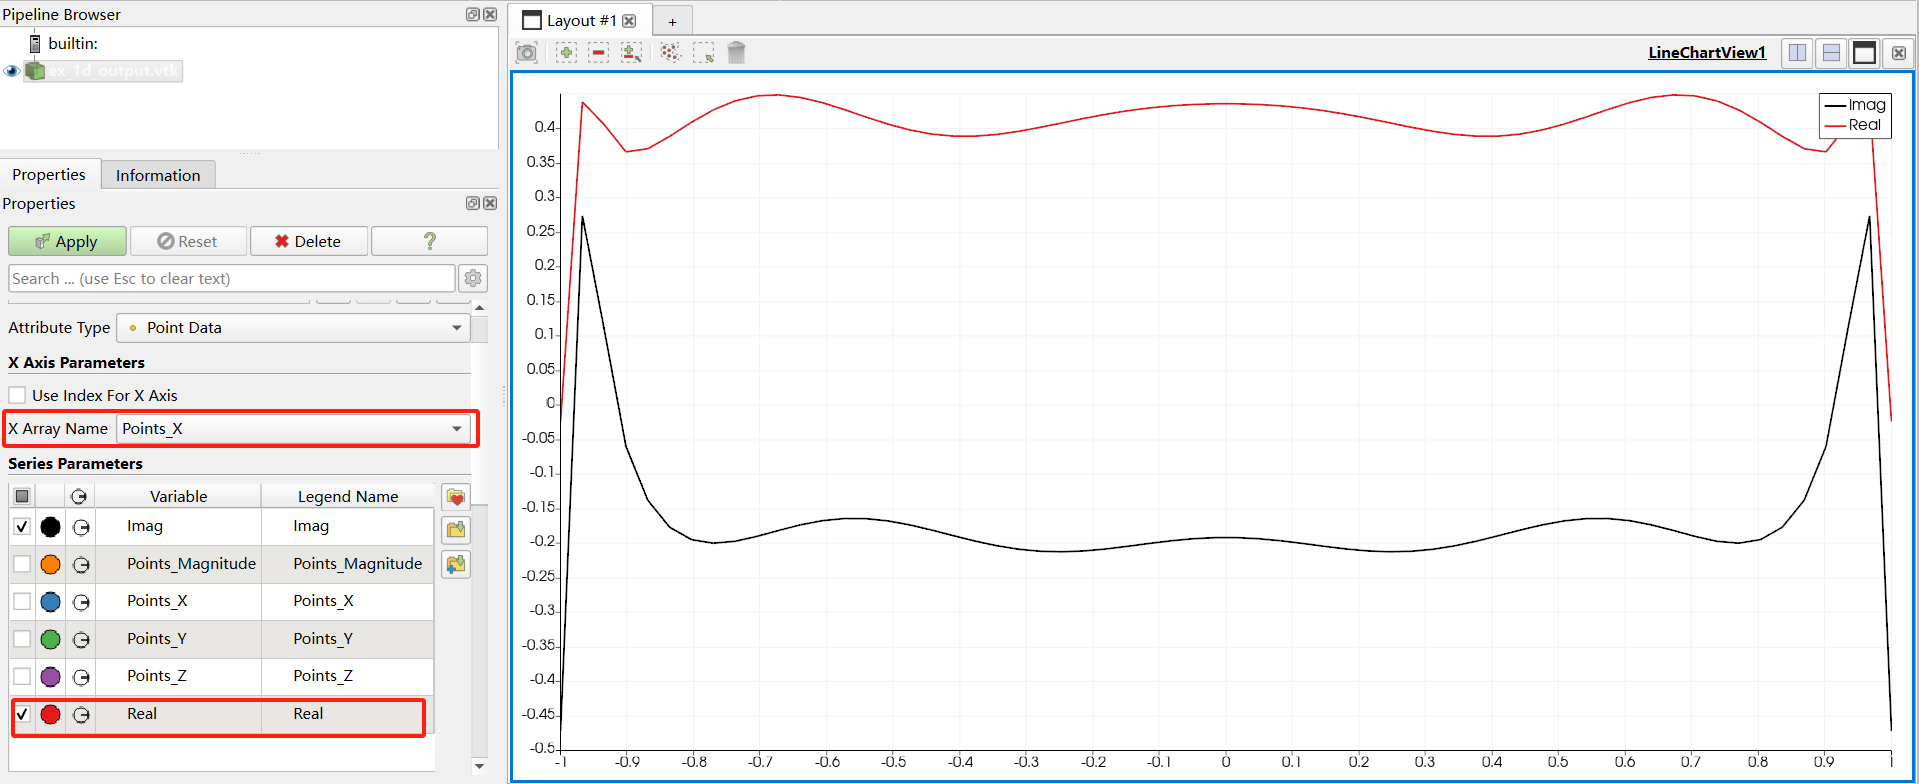
Read a vtk file, plot the read data in the Line Chart View component, and specify the option of X Array Name as Points\_X and the option of Series Paarameteres as Real in the properties interface.
How can I achieve it? Thank you very much!
---
### Author:  [@mwestphal](https://discourse.paraview.org/u/mwestphal)
#### Post date: [May 20, 2025, 2:38pm UTC](https://discourse.paraview.org/t/how-to-read-a-vtk-file-and-draw-a-line-graph/16671/2 "2025-05-20T14:38:44Z")
> [@flipper](#):
>
> c++ interface of paraview
What do you mean by that ? Do you want to create your own ParaView based application ? Do you want to use VTK to do that ?
---
### Author:  [@flipper](https://discourse.paraview.org/u/flipper)
#### Post date: [May 20, 2025, 3:30pm UTC](https://discourse.paraview.org/t/how-to-read-a-vtk-file-and-draw-a-line-graph/16671/3 "2025-05-20T15:30:14Z")
I want to achieve the above operations by calling the corresponding methods on the ParaView based application that I have created.
---
### Author:  [@mwestphal](https://discourse.paraview.org/u/mwestphal)
#### Post date: [May 20, 2025, 3:45pm UTC](https://discourse.paraview.org/t/how-to-read-a-vtk-file-and-draw-a-line-graph/16671/4 "2025-05-20T15:45:56Z")
> [@flipper](#):
>
> Read a vtk file
Create the correct proxy and update it
> plot the read data in the Line Chart View component,
Create the correct view and show the data in it
> specify the option of X Array Name as Points\_X and the option of Series Paarameteres as Real
Set the representation properties
Find examples here: [https://gitlab.kitware.com/paraview/paraview/-/tree/master/Examples/CustomApplications?ref\_type=heads](https://gitlab.kitware.com/paraview/paraview/-/tree/master/Examples/CustomApplications?ref_type=heads)
---
### Author:  [@flipper](https://discourse.paraview.org/u/flipper)
#### Post date: [May 21, 2025, 3:44am UTC](https://discourse.paraview.org/t/how-to-read-a-vtk-file-and-draw-a-line-graph/16671/5 "2025-05-21T03:44:57Z")
Thank you for your answer!
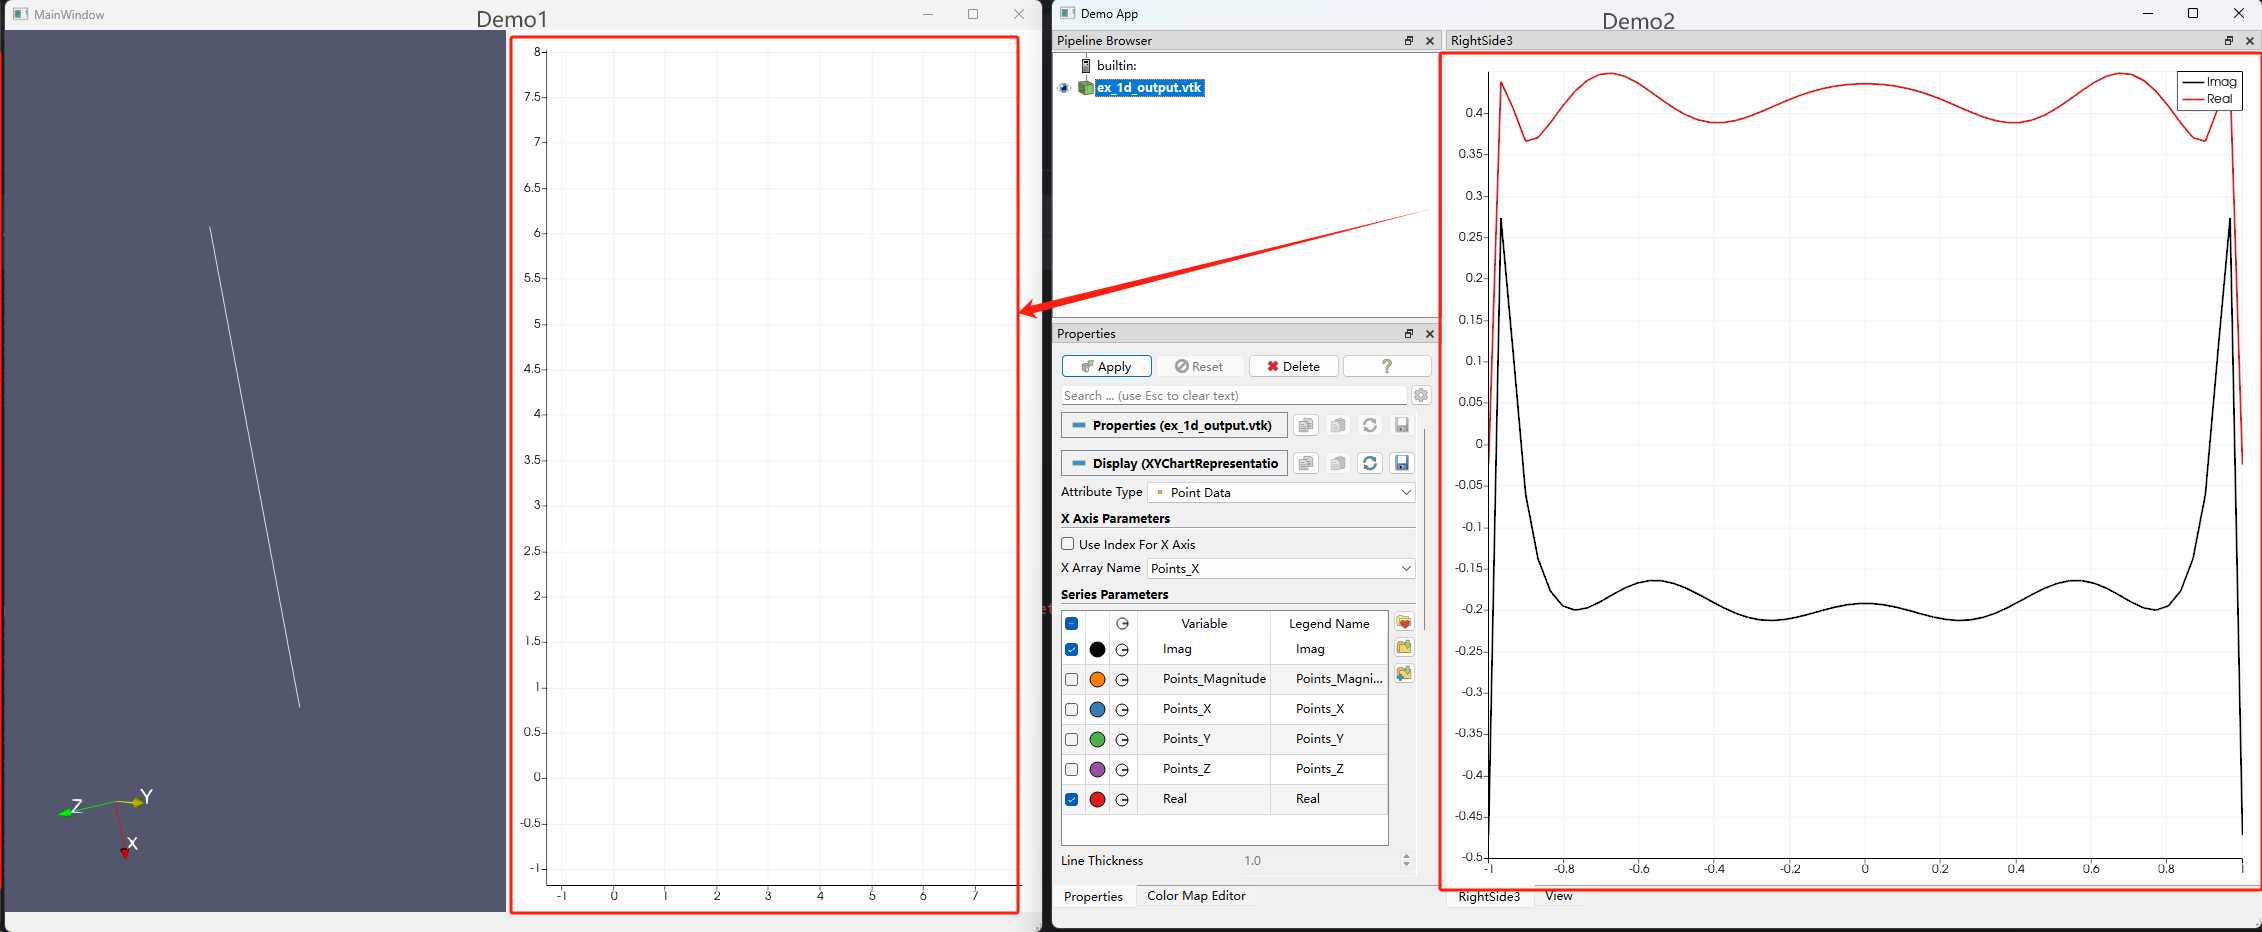
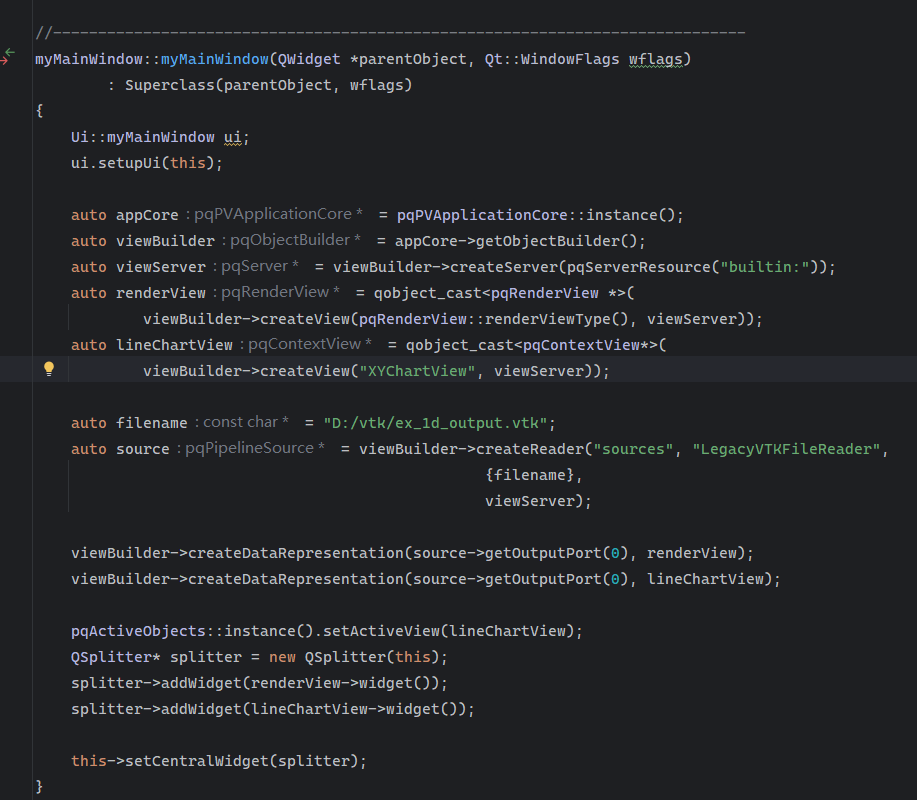
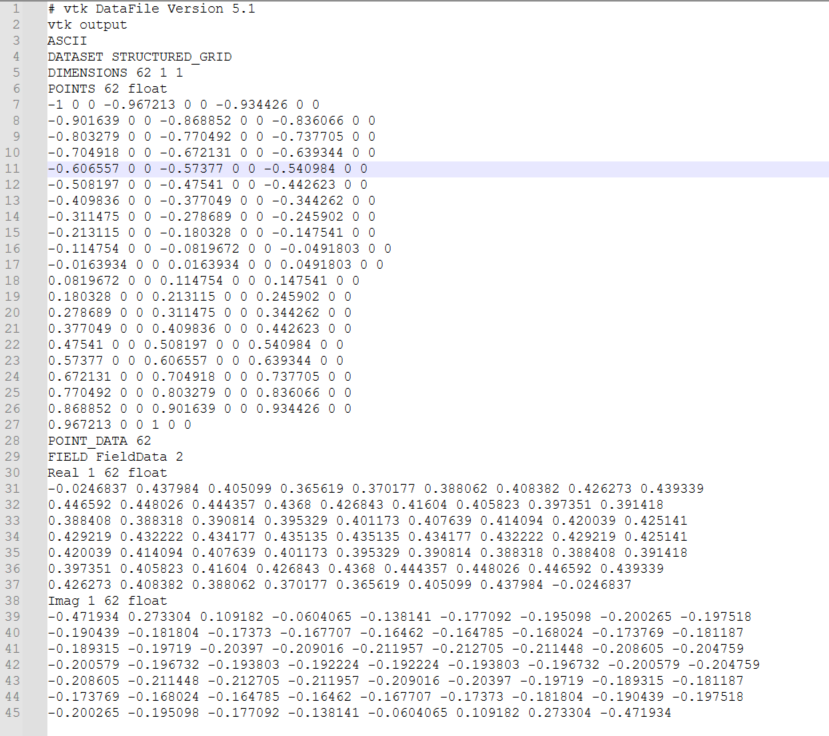
I made some attempts with examples. I loaded a vtk file in demo1. It could be directly displayed in the render view, but it could never be directly displayed in the line chart view. I hope to obtain the same line graph in the line chart view of demo1 as that in demo2. How can the vtk file be displayed directly in the line chart view of demo1 without any other operations? Does this implementation have any requirements for the vtk file?
I have placed the code of demo1 and the vtk file below.
---
### Author:  [@mwestphal](https://discourse.paraview.org/u/mwestphal)
#### Post date: [May 21, 2025, 4:44am UTC](https://discourse.paraview.org/t/how-to-read-a-vtk-file-and-draw-a-line-graph/16671/6 "2025-05-21T04:44:00Z")
> [@flipper](#):
>
> I hope to obtain the same line graph in the line chart view of demo1 as that in demo2.
You need to turn on the series you want to show using the right property.
---
### Author:  [@flipper](https://discourse.paraview.org/u/flipper)
#### Post date: [May 22, 2025, 2:43am UTC](https://discourse.paraview.org/t/how-to-read-a-vtk-file-and-draw-a-line-graph/16671/7 "2025-05-22T02:43:44Z")
Ok, thank you very much!