# How to render 3D bathymetry data
**URL:** https://discourse.paraview.org/t/how-to-render-3d-bathymetry-data/2945
**Category:** ParaView Support
**Created:** [November 10, 2019, 4:00am UTC](https://discourse.paraview.org/t/how-to-render-3d-bathymetry-data/2945 "2019-11-10T04:00:30Z")
**Posts on this page:** 4
**Page:** 1
### Author:  [@yijianmingliu](https://discourse.paraview.org/u/yijianmingliu)
#### Post date: [November 10, 2019, 4:00am UTC](https://discourse.paraview.org/t/how-to-render-3d-bathymetry-data/2945/1 "2019-11-10T04:00:30Z")
Hi,I am quite new to paraview, I’d like to use paraview for visualizing bathymetry data.
I have a netCDF file containing the lat, lon, and elevation ,
Like in this picture, I also want to do this.,
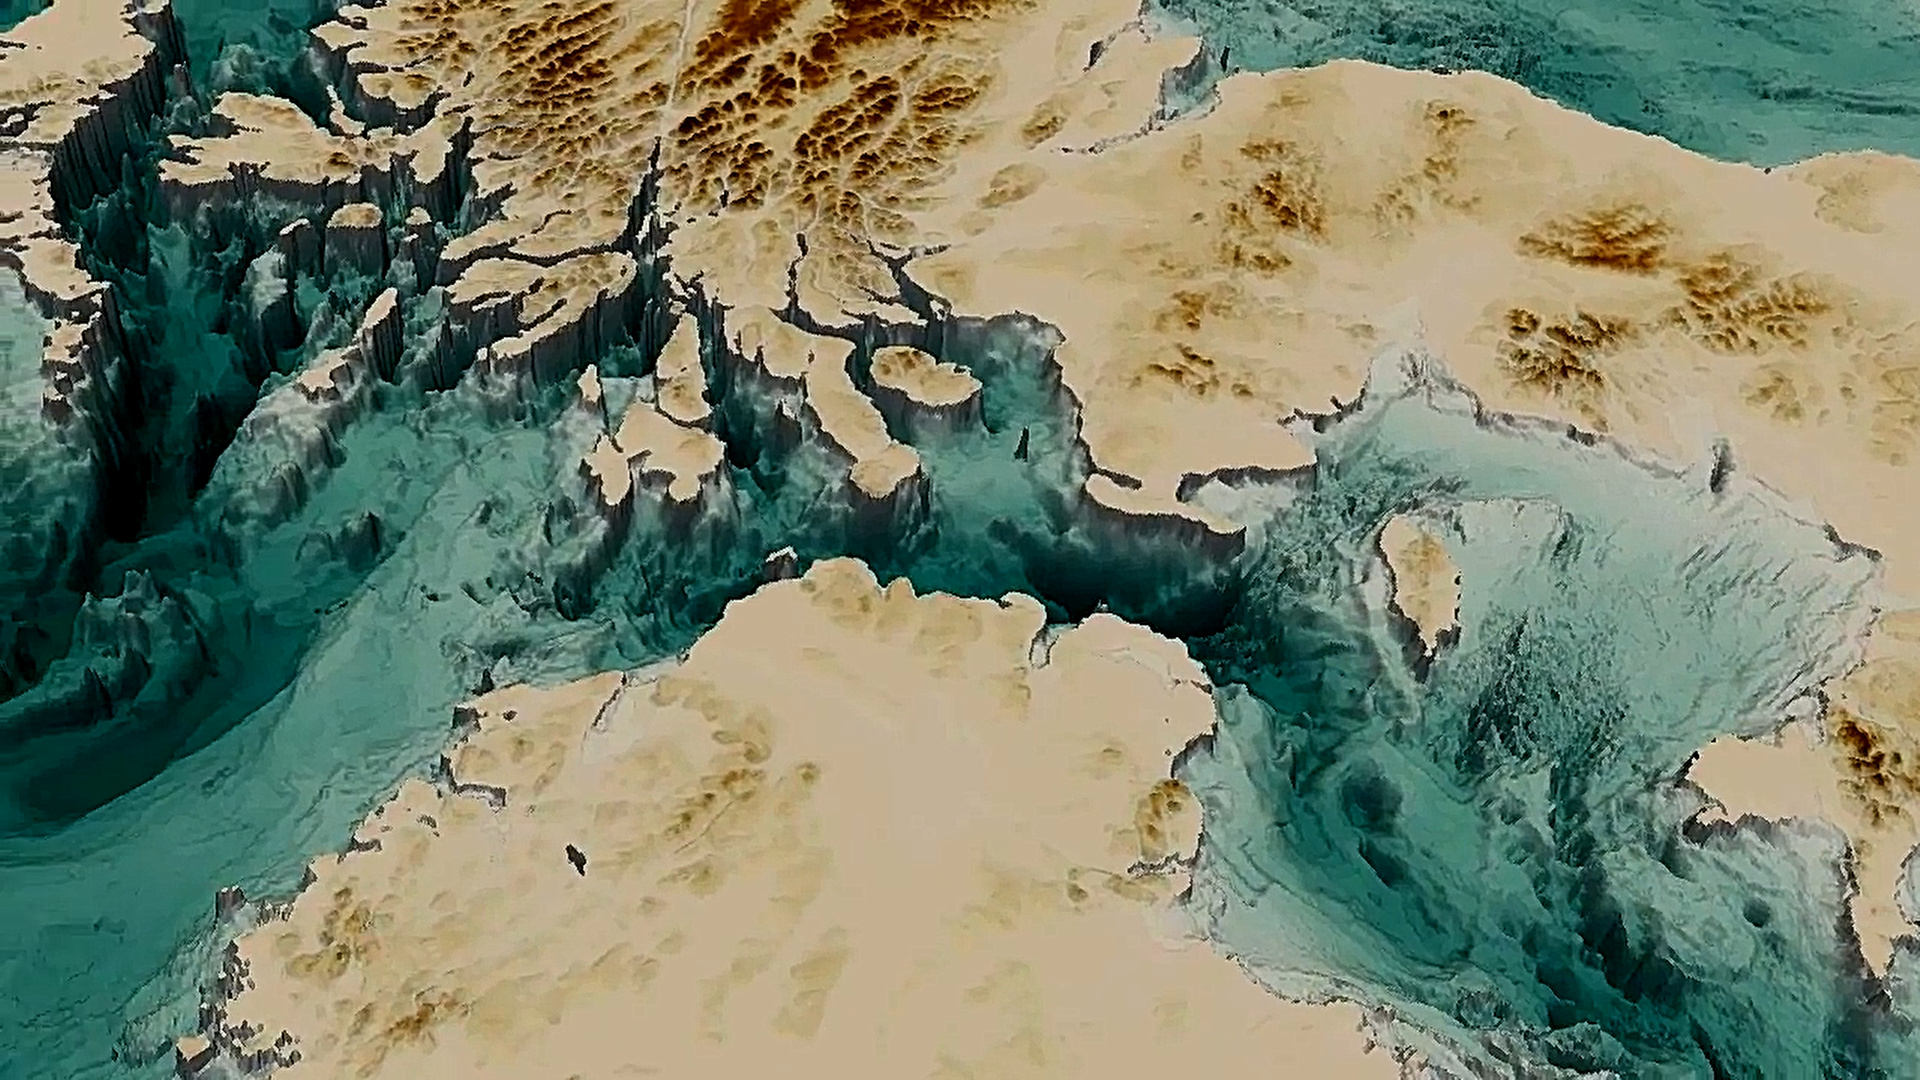
I use the‘Warp by scalar’,
However, this is not the same as I expected.
This is the result I got:
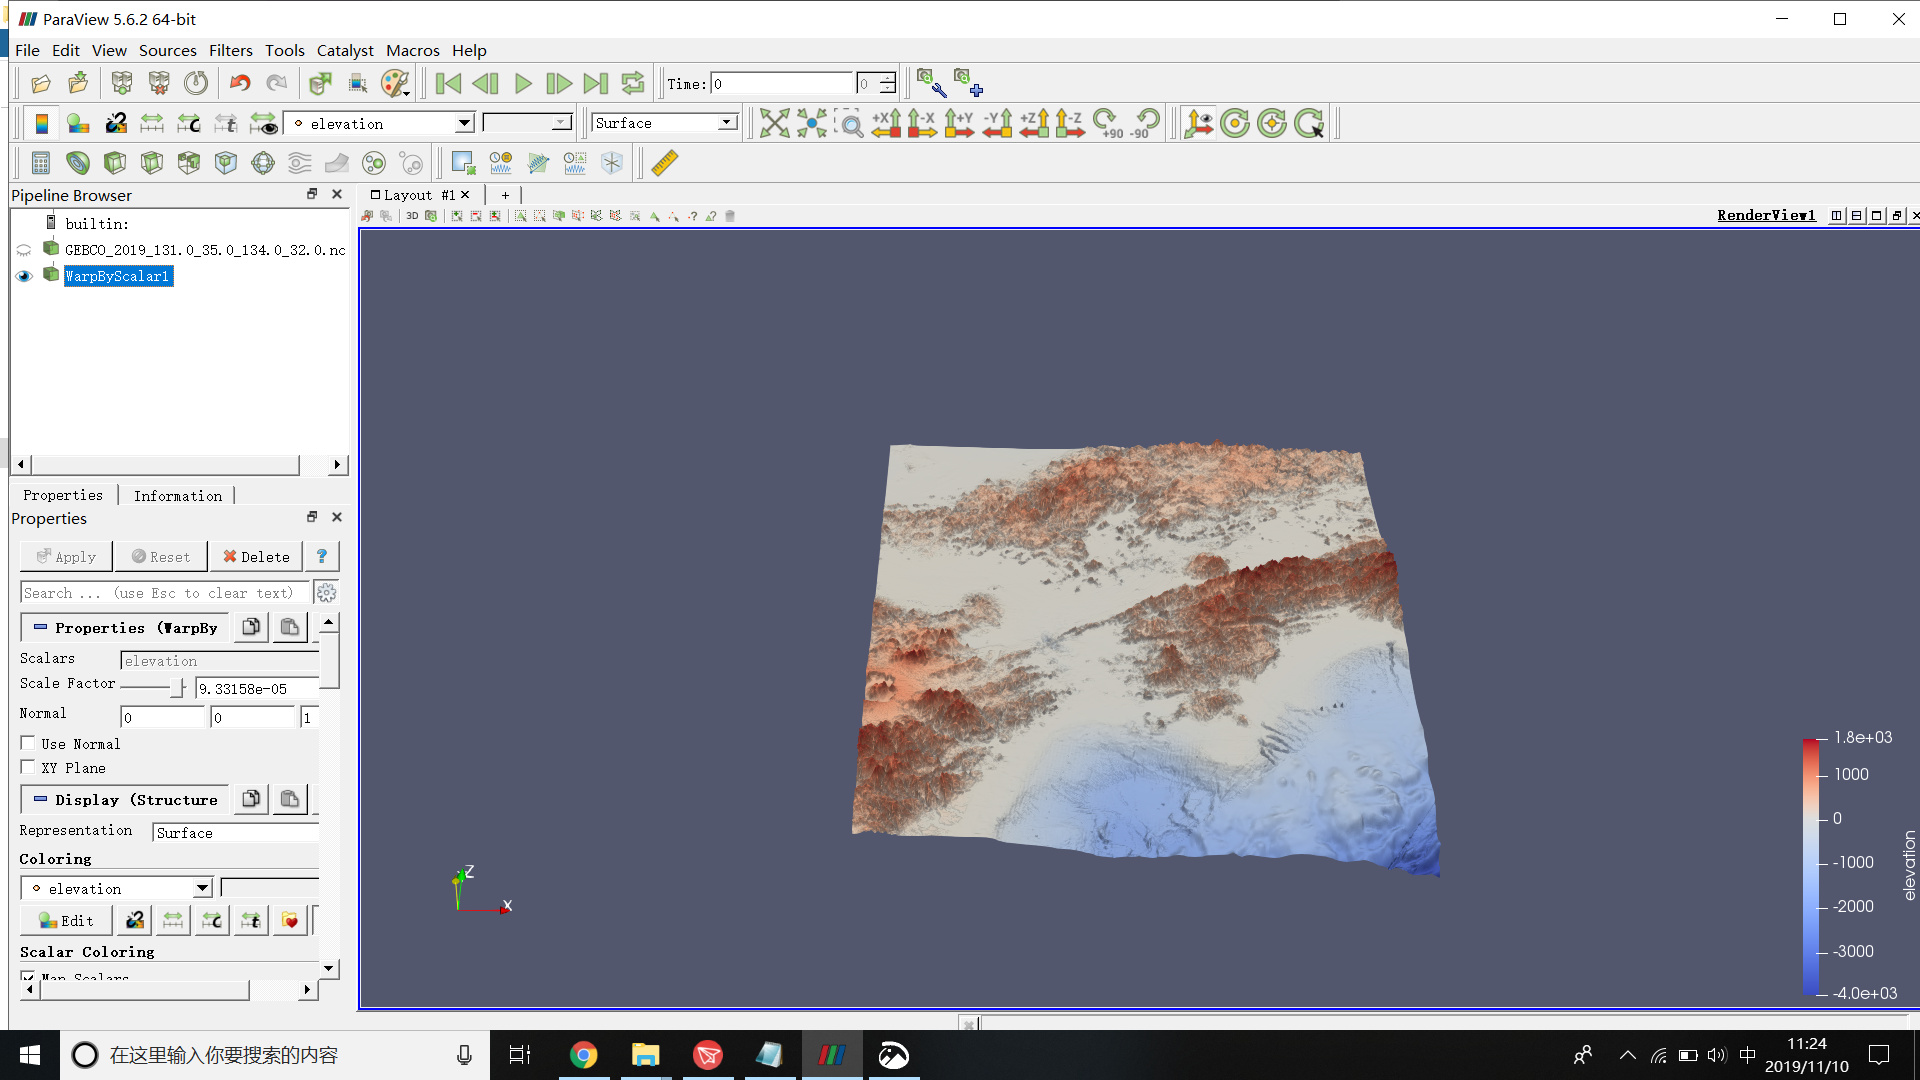
This is my nc file:
[GEBCO\_2019\_131.0\_35.0\_134.0\_32.0.nc](https://www.dropbox.com/s/f6mptbtcqmokj0o/GEBCO_2019_131.0_35.0_134.0_32.0.nc?dl=0)
Can I get the results I expected with my current data?
I’m sorry for bad English.
Can you help me understand if this is possible.
Thanks for the help! 😃
---
### Author:  [@cory.quammen](https://discourse.paraview.org/u/cory.quammen)
#### Post date: [November 10, 2019, 2:41pm UTC](https://discourse.paraview.org/t/how-to-render-3d-bathymetry-data/2945/2 "2019-11-10T14:41:54Z")
I see two differences:
- color
- surface height
Are there other differences you see?
For the first problem, I recommend following Chapter 2 of the [ParaView Tutorial](https://www.paraview.org/paraview-downloads/download.php?submit=Download&version=v5.7&type=data&os=Sources&downloadFile=ParaViewTutorial-5.7.0.pdf), which addresses how to change the color map and gives you a very thorough understanding of how to use ParaView’s basic features.
For the second problem, adjust the _Scale Factor_ setting in the _Properties Panel_ to make it bigger or smaller.
---
### Author:  [@yijianmingliu](https://discourse.paraview.org/u/yijianmingliu)
#### Post date: [November 11, 2019, 8:20am UTC](https://discourse.paraview.org/t/how-to-render-3d-bathymetry-data/2945/3 "2019-11-11T08:20:20Z")
Thanks for looking into this! I think i understand.😃
---
### Author:  [@mwestphal](https://discourse.paraview.org/u/mwestphal)
#### Post date: [November 12, 2019, 9:21am UTC](https://discourse.paraview.org/t/how-to-render-3d-bathymetry-data/2945/4 "2019-11-12T09:21:15Z")
You may also want to take a look into this blog :
> **[A new Embossing Representations Plugin for ParaView - Kitware Blog](https://blog.kitware.com/a-new-embossing-representations-plugin-for-paraview/)**
>
> Context Besides being large, climate simulations are usually comprised of many different variables and quantities that often need to be visualized side by side. The ... Read More