# How to Show() a simple vtkImageData object
**URL:** https://discourse.paraview.org/t/how-to-show-a-simple-vtkimagedata-object/7745
**Category:** ParaView Support
**Tags:** python, vtk
**Created:** [August 2, 2021, 11:03pm UTC](https://discourse.paraview.org/t/how-to-show-a-simple-vtkimagedata-object/7745 "2021-08-02T23:03:48Z")
**Posts on this page:** 9
**Page:** 1
### Author:  [@bva99](https://discourse.paraview.org/u/bva99)
#### Post date: [August 2, 2021, 11:03pm UTC](https://discourse.paraview.org/t/how-to-show-a-simple-vtkimagedata-object/7745/1 "2021-08-02T23:03:48Z")
How does one create a simple 2D mesh plot using ParaView from a `vtkImageData` object. This type of object is mentioned in the [ParaView Guide](https://docs.paraview.org/en/latest/) in “3. Understanding data”, but it is never shown how to use use it directly.
```auto
import numpy as np
from paraview import vtk, simple
from paraview.vtk.util.numpy_support import numpy_to_vtk
from vtk import vtkImageDataGeometryFilter # this isn't in paraview.vtk
# Create an image (this is a data object)
myMesh = vtk.vtkImageData()
myMesh.SetOrigin(0., 0., 0.)
myMesh.SetSpacing(0.01, 0.01, 0.)
myMesh.SetExtent(0, 100, 0, 50, 0, 0)
# coloring
blue = np.array([15, 82, 186], dtype=np.ubyte)
# numpy colors
scalarsnp = np.tile(blue, (myMesh.GetNumberOfCells(), 1))
# vtk array colors. Organized as 50 tuples of 3
scalarsvtk = numpy_to_vtk(scalarsnp, deep=1, array_type=vtk.VTK_UNSIGNED_CHAR)
# allocate the scalars to the vtkImageData object
# Not sure why the following line is not necessary (tested using VTK)
# myMesh.AllocateScalars(vtk.VTK_UNSIGNED_CHAR, 3) # set 3 scalars per cell
myMesh.GetCellData().SetScalars(scalarsvtk)
# generate a vtkPolyData from the vtkImageData
myMeshPD = vtkImageDataGeometryFilter()
myMeshPD.SetInputData(myMesh)
# more code...
simple.Show(??)
simple.Interact() # or simple.Render()
```
Now if I were to use pure VTK, I’d create a mapper, an actor and render everything to a window.
The question is, at which point of the above pipeline is it possible to use Paraview, if at all?
From my very limited understanding on the subject, I think it is possible to generate a proxy out one of the aforementioned objects (using `paraview.servermanager` maybe?) and then use `paraview.simple.Show`. But I am not sure and am completely lost in the Paraview documentation.
---
### Author:  [@mwestphal](https://discourse.paraview.org/u/mwestphal)
#### Post date: [August 3, 2021, 7:38am UTC](https://discourse.paraview.org/t/how-to-show-a-simple-vtkimagedata-object/7745/2 "2021-08-03T07:38:53Z")
You need to “send” your image data to the paraview server. This is only possible in builtin mode uising a TrivialProducer and GetClientSideObject.
---
### Author:  [@bva99](https://discourse.paraview.org/u/bva99)
#### Post date: [August 3, 2021, 7:08pm UTC](https://discourse.paraview.org/t/how-to-show-a-simple-vtkimagedata-object/7745/3 "2021-08-03T19:08:12Z")
Thank you Mathieu!
I’ve successfully rendered the mesh in ParaView! Instead of `vtkImageDataGeometryFilter`, I can use `vtkTextureMapToPlane`, or rather `TextureMaptoPlane` from `paraview.simple`.
Though, I think I might have found a bug in version 5.9.1.
You see, if I use, from the above example:
```auto
myMesh.GetCellData().SetScalars(scalarsvtk)
```
then ParaView cannot see the colors array.
Instead, the following has to be done (taken from [this VTK pipermail vtkusers](https://vtk.org/pipermail/vtkusers/2012-July/075534.html)):
```auto
scalarsvtk = numpy_to_vtk(scalarsnp, deep=1, array_type=vtk.VTK_UNSIGNED_CHAR)
scalarsvtk.SetName("colorsArray")
colorArrayID = myMesh.GetCellData().AddArray(scalarsvtk)
myMesh.GetCellData().SetActiveScalars(scalarsvtk.GetName())
```
Edit: in other words, I changed from using `SetScalars` to using `AddArray` and `SetActiveScalars`. Then ParaView managed to access the array.
---
### Author:  [@bva99](https://discourse.paraview.org/u/bva99)
#### Post date: [August 3, 2021, 7:10pm UTC](https://discourse.paraview.org/t/how-to-show-a-simple-vtkimagedata-object/7745/4 "2021-08-03T19:10:37Z")
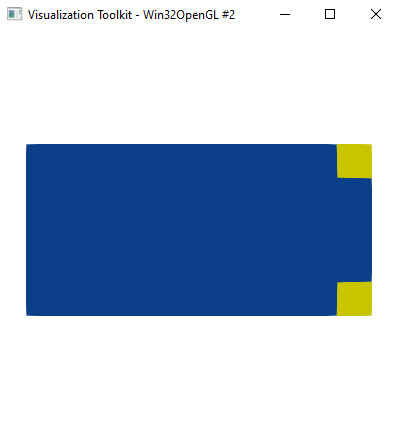
A minimum working example (which could be used for a github/paraview/examples page, sort of like VTK):
```auto
from paraview import simple as ps
from paraview import vtk
from paraview.vtk.util.numpy_support import numpy_to_vtk
import numpy as np
def main():
# Create an image (this is a data object)
myMesh = vtk.vtkImageData()
myMesh.SetOrigin(0., 0., 0.)
myMesh.SetSpacing(0.1, 0.1, 0.)
myMesh.SetExtent(0, 10, 0, 5, 0, 0)
# coloring
blue = np.array([15, 82, 186], dtype=np.ubyte)
# numpy colors
scalarsnp = np.tile(blue, (myMesh.GetNumberOfCells(), 1))
scalarsnp[[9, 49]] = np.array([255, 255, 0], dtype=np.ubyte) # yellow
# vtk array colors. Organized as 50 tuples of 3
scalarsvtk = numpy_to_vtk(scalarsnp, deep=1, array_type=vtk.VTK_UNSIGNED_CHAR)
scalarsvtk.SetName("colorsArray")
# allocate the scalars to the vtkImageData object
# myMesh.AllocateScalars(vtk.VTK_UNSIGNED_CHAR, 3) # set 3 scalars per cell
# myMesh.GetCellData().SetScalars(scalarsvtk) # do not use this in ParaView!!
colorArrayID = myMesh.GetCellData().AddArray(scalarsvtk)
myMesh.GetCellData().SetActiveScalars(scalarsvtk.GetName())
# TrivialProducer to interface ParaView to serverside objects
tp_mesh = ps.TrivialProducer(registrationName="tp_mesh")
myMeshClient = tp_mesh.GetClientSideObject()
# link the vtkImageData object to the proxy manager
myMeshClient.SetOutput(myMesh)
tp_mesh.UpdatePipeline()
# Filter for showing the ImageData to a plane
mapTexture2Plane = ps.TextureMaptoPlane(registrationName="TM2P_mesh", Input=tp_mesh)
renderViewMesh = ps.CreateView("RenderView")
renderViewMesh.Background = [1, 1, 1]
renderViewMesh.OrientationAxesVisibility = 0
display = ps.Show(proxy=mapTexture2Plane, view=renderViewMesh)
display.SetRepresentationType("Surface")
display.MapScalars = 0 # necessary so as to not generate a colormap
ps.Interact() # or just ps.Render()
if __name__ == " __main__":
main()
```
* * *
Edited to disable scalar mapping. Also hid the orientation axes.
Output:
---
### Author:  [@bva99](https://discourse.paraview.org/u/bva99)
#### Post date: [August 3, 2021, 7:15pm UTC](https://discourse.paraview.org/t/how-to-show-a-simple-vtkimagedata-object/7745/5 "2021-08-03T19:15:40Z")
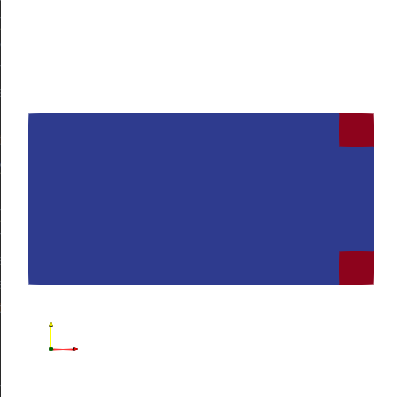
Before I close this issue, though, it seems that the yellow cells from the above minimum working example are being shown as red instead of yellow. Is there something more to the array orders that I have missed?
---
### Author:  [@mwestphal](https://discourse.paraview.org/u/mwestphal)
#### Post date: [August 4, 2021, 7:18am UTC](https://discourse.paraview.org/t/how-to-show-a-simple-vtkimagedata-object/7745/6 "2021-08-04T07:18:02Z")
Please share the faulty data
---
### Author:  [@bva99](https://discourse.paraview.org/u/bva99)
#### Post date: [August 4, 2021, 12:49pm UTC](https://discourse.paraview.org/t/how-to-show-a-simple-vtkimagedata-object/7745/7 "2021-08-04T12:49:54Z")
After some testing, it seems that the data is not faulty. I am just not using the ParaView filters correctly. It seems to automatically apply a color map instead of assigning the given RGB colors as the face color for each cell. A legacy ASCII VTK file of the imagedata can be found attached. I simplified the blue color to be [0 0 255] for an easier read.
[ImageData.vtk](https://discourse.paraview.org/uploads/short-url/1BvHZ53z4pKKOLNBegMN0P6yTdX.vtk) (519 Bytes)
From what I’ve read in the VTK doxygen, I have to enable the creation of a lookuptable based on the CellData, for the colors. I’m not sure which method I should use for this. And whether it is in the vtkImageData itself, or in the object obtained after applying the filter in ParaView. The class that has this functionality seems to be `vtkMapper`. Not sure how to use it.
---
### Author:  [@Kenneth\_Moreland](https://discourse.paraview.org/u/Kenneth_Moreland)
#### Post date: [August 4, 2021, 12:57pm UTC](https://discourse.paraview.org/t/how-to-show-a-simple-vtkimagedata-object/7745/8 "2021-08-04T12:57:00Z")
Uncheck the `Map Scalars` option in the properties panel.
---
### Author:  [@bva99](https://discourse.paraview.org/u/bva99)
#### Post date: [August 4, 2021, 1:24pm UTC](https://discourse.paraview.org/t/how-to-show-a-simple-vtkimagedata-object/7745/9 "2021-08-04T13:24:07Z")
Thank you Kenneth! That does the job. I had to Toggle advanced properties to find that option.