# How to show the boundary/outline of a curved region?
**URL:** https://discourse.paraview.org/t/how-to-show-the-boundary-outline-of-a-curved-region/11293
**Category:** ParaView Support
**Created:** [January 29, 2023, 2:07pm UTC](https://discourse.paraview.org/t/how-to-show-the-boundary-outline-of-a-curved-region/11293 "2023-01-29T14:07:06Z")
**Posts on this page:** 2
**Page:** 1
### Author:  [@nwscfd](https://discourse.paraview.org/u/nwscfd)
#### Post date: [January 29, 2023, 2:07pm UTC](https://discourse.paraview.org/t/how-to-show-the-boundary-outline-of-a-curved-region/11293/1 "2023-01-29T14:07:06Z")
I am visualizing CFD results from a nozzle simulated in OpenFOAM. My colormap shows high temperatures as a white-ish color, as seen below.

Here’s what it looks like with a different colormap:
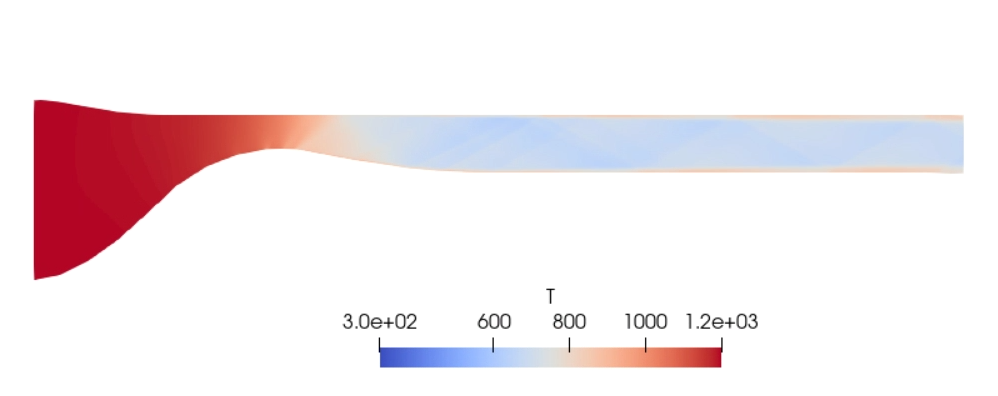
How can I render a boundary around the entire computational domain so that the shape of the nozzle is visible on the left?
---
### Author:  [@jkulesza](https://discourse.paraview.org/u/jkulesza)
#### Post date: [March 24, 2023, 1:08pm UTC](https://discourse.paraview.org/t/how-to-show-the-boundary-outline-of-a-curved-region/11293/2 "2023-03-24T13:08:59Z")
Does “Feature Edges” give the desired appearance (perhaps loading the dataset twice, once with the temperature field and once with Feature Edges)?