# How to specific the number of sampling points of "plot on sorted line" filter
**URL:** https://discourse.paraview.org/t/how-to-specific-the-number-of-sampling-points-of-plot-on-sorted-line-filter/12737
**Category:** ParaView Support
**Created:** [August 23, 2023, 8:34am UTC](https://discourse.paraview.org/t/how-to-specific-the-number-of-sampling-points-of-plot-on-sorted-line-filter/12737 "2023-08-23T08:34:51Z")
**Posts on this page:** 5
**Page:** 1
### Author:  [@pearlpirate](https://discourse.paraview.org/u/pearlpirate)
#### Post date: [August 23, 2023, 8:34am UTC](https://discourse.paraview.org/t/how-to-specific-the-number-of-sampling-points-of-plot-on-sorted-line-filter/12737/1 "2023-08-23T08:34:51Z")
Dear paraview users and developers,
As we all know, we can specify how many sampling points we want when using “plot over line” filter. But is there a way to do the same thing in the filter of “plot on sorted line”? It seems the numuber of points can only be the same as mesh points. Thank you in advance.
Best regards,
Kevin
---
### Author:  [@mwestphal](https://discourse.paraview.org/u/mwestphal)
#### Post date: [August 23, 2023, 8:46am UTC](https://discourse.paraview.org/t/how-to-specific-the-number-of-sampling-points-of-plot-on-sorted-line-filter/12737/2 "2023-08-23T08:46:17Z")
> [@pearlpirate](#):
>
> “plot on sorted line”?
Can you clarify what you have in mind ?
---
### Author:  [@pearlpirate](https://discourse.paraview.org/u/pearlpirate)
#### Post date: [August 23, 2023, 9:08am UTC](https://discourse.paraview.org/t/how-to-specific-the-number-of-sampling-points-of-plot-on-sorted-line-filter/12737/4 "2023-08-23T09:08:53Z")
Hi Mathieu,
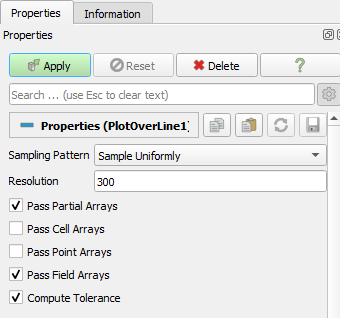
Thanks for your quick reply. As shown in the image below, we can specify the resolution of data extracted by “plot over line” filter. So can we specify the resolution of data extracted by “plot on sorted lines” filter?
---
### Author:  [@mwestphal](https://discourse.paraview.org/u/mwestphal)
#### Post date: [August 23, 2023, 9:53am UTC](https://discourse.paraview.org/t/how-to-specific-the-number-of-sampling-points-of-plot-on-sorted-line-filter/12737/5 "2023-08-23T09:53:58Z")
Plot on sorted lines is not generating a line but instead uses the geometry of the input. You can modify that geometry before using Plot on sorted lines, eg masking half the points.
---
### Author:  [@pearlpirate](https://discourse.paraview.org/u/pearlpirate)
#### Post date: [August 24, 2023, 2:42am UTC](https://discourse.paraview.org/t/how-to-specific-the-number-of-sampling-points-of-plot-on-sorted-line-filter/12737/6 "2023-08-24T02:42:16Z")
I see, thanks a lot for your reply.