# How to view the data restrict to certain x range
**URL:** https://discourse.paraview.org/t/how-to-view-the-data-restrict-to-certain-x-range/1612
**Category:** ParaView Support
**Tags:** exodus
**Created:** [April 7, 2019, 1:43am UTC](https://discourse.paraview.org/t/how-to-view-the-data-restrict-to-certain-x-range/1612 "2019-04-07T01:43:00Z")
**Posts on this page:** 5
**Page:** 1
### Author:  [@Wesley](https://discourse.paraview.org/u/Wesley)
#### Post date: [April 7, 2019, 1:43am UTC](https://discourse.paraview.org/t/how-to-view-the-data-restrict-to-certain-x-range/1612/1 "2019-04-07T01:43:00Z")
Hi,
Previously we’ve been able to solve “[How to view the data restrict to one domain](https://discourse.paraview.org/t/how-to-view-the-data-restrict-to-one-domain/334)”, now I wonder if we can view the data restrict to certain x range, as the part circled out is not desired, I am thinking if I can restrict the x range for this particular variable from 20\<= x \< 39.5 (it is 20\<= x \<= 40 shown in the picture), then this vertical line can be erased.
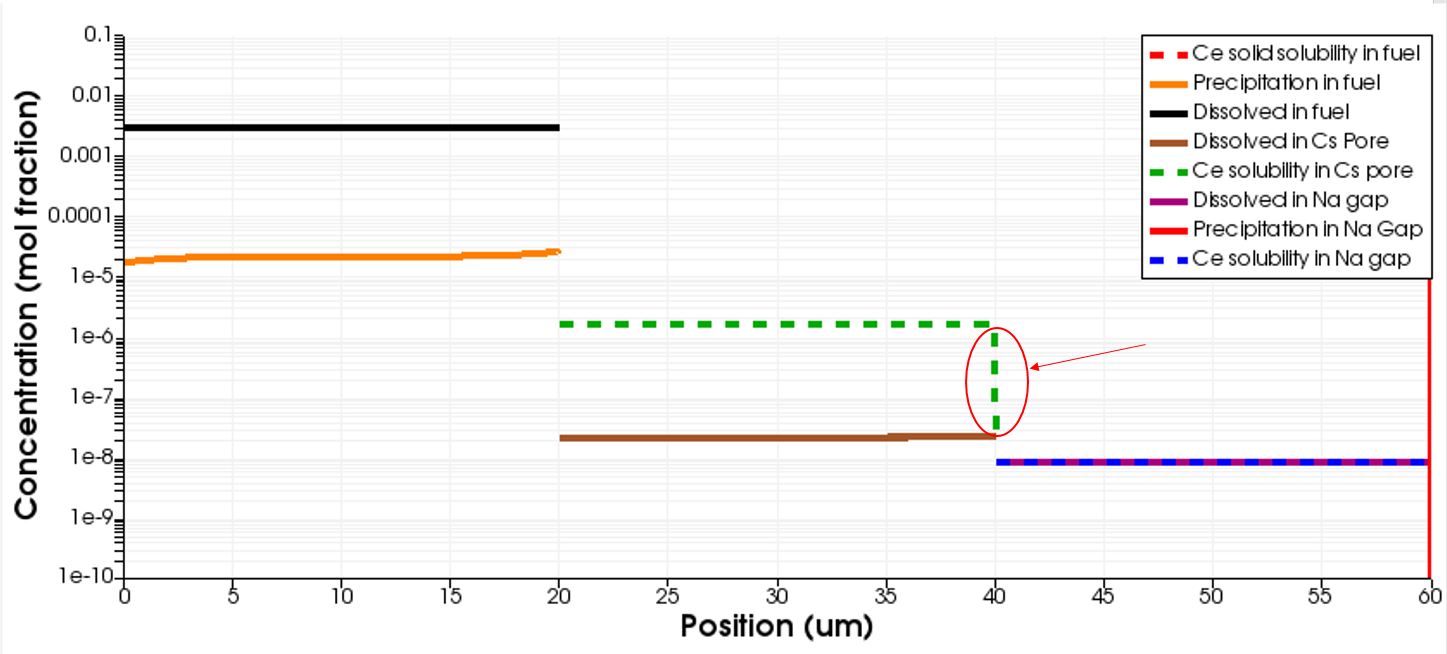
Thanks.
---
### Author:  [@utkarsh.ayachit](https://discourse.paraview.org/u/utkarsh.ayachit)
#### Post date: [April 7, 2019, 12:22pm UTC](https://discourse.paraview.org/t/how-to-view-the-data-restrict-to-certain-x-range/1612/2 "2019-04-07T12:22:02Z")
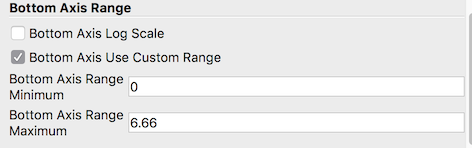
On the **Properties** panel, check **Bottom Axis Use Custom Range** and then specify the range of interest.
---
### Author:  [@Wesley](https://discourse.paraview.org/u/Wesley)
#### Post date: [April 7, 2019, 12:42pm UTC](https://discourse.paraview.org/t/how-to-view-the-data-restrict-to-certain-x-range/1612/3 "2019-04-07T12:42:46Z")
Hi Utkarsh, I am aware of this, the question is I need to display 0-60 for other variables. It seems that I cannot use custom range for particular single one variable.
Regards.
---
### Author:  [@utkarsh.ayachit](https://discourse.paraview.org/u/utkarsh.ayachit)
#### Post date: [April 7, 2019, 1:41pm UTC](https://discourse.paraview.org/t/how-to-view-the-data-restrict-to-certain-x-range/1612/4 "2019-04-07T13:41:59Z")
Create a filter to threadshold/clip/subset (whatever is applicable) off the extra bits then show both the results of this filter and the original data in the same chart view selecting the appropriate data arrays.
---
### Author:  [@Wesley](https://discourse.paraview.org/u/Wesley)
#### Post date: [April 7, 2019, 6:15pm UTC](https://discourse.paraview.org/t/how-to-view-the-data-restrict-to-certain-x-range/1612/5 "2019-04-07T18:15:17Z")
Yes, that works, thank you!