# How to visualize a matrix as an array of 3d blocks?
**URL:** https://discourse.paraview.org/t/how-to-visualize-a-matrix-as-an-array-of-3d-blocks/2519
**Category:** ParaView Support
**Created:** [September 5, 2019, 11:43pm UTC](https://discourse.paraview.org/t/how-to-visualize-a-matrix-as-an-array-of-3d-blocks/2519 "2019-09-05T23:43:15Z")
**Posts on this page:** 2
**Page:** 1
### Author:  [@parajan](https://discourse.paraview.org/u/parajan)
#### Post date: [September 5, 2019, 11:43pm UTC](https://discourse.paraview.org/t/how-to-visualize-a-matrix-as-an-array-of-3d-blocks/2519/1 "2019-09-05T23:43:15Z")
I would like visualize this dataset:
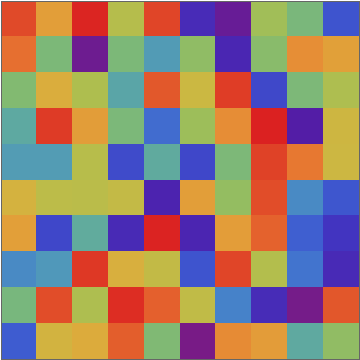
as an array of 3d blocks / cuboids, whose height scales with the value of the element. It should result in the following picture:
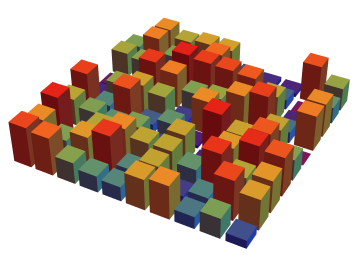
Is it possible to do this in ParaView?
I tried using the filters Cell Data To Point Data + Warp By Scalar, but then I get a continuously deformed surface.
Attached is a text file with data: [data.dat](https://discourse.paraview.org/uploads/short-url/i09Gov2gPbxIOJDY8CVZfsxy3Kx.dat) (1.9 KB)
---
### Author:  [@mwestphal](https://discourse.paraview.org/u/mwestphal)
#### Post date: [September 6, 2019, 1:23am UTC](https://discourse.paraview.org/t/how-to-visualize-a-matrix-as-an-array-of-3d-blocks/2519/2 "2019-09-06T01:23:04Z")
If this is for **visualization purpose only** , Extrusion Surface seems to do the trick :
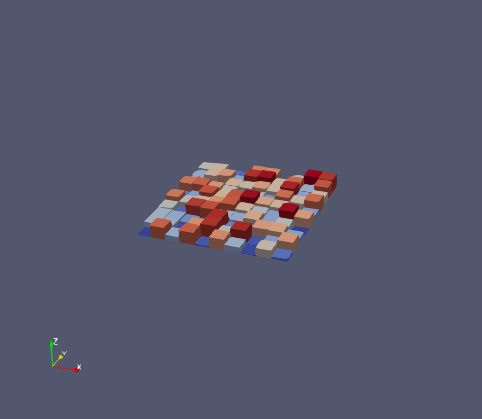
- Tools -\> Manage Plugin -\> Embossing Representations -\> Load
- Create a new view
- Show your dataset
- Switch to “Extrusion Surface” representation