# I need help with creating 3D from multiple 2D profiles of electrical resistivity data
**URL:** https://discourse.paraview.org/t/i-need-help-with-creating-3d-from-multiple-2d-profiles-of-electrical-resistivity-data/14387
**Category:** ParaView Support
**Created:** [April 11, 2024, 8:31pm UTC](https://discourse.paraview.org/t/i-need-help-with-creating-3d-from-multiple-2d-profiles-of-electrical-resistivity-data/14387 "2024-04-11T20:31:29Z")
**Posts on this page:** 4
**Page:** 1
### Author:  [@Adetokunbo\_Peter](https://discourse.paraview.org/u/Adetokunbo_Peter)
#### Post date: [April 11, 2024, 8:31pm UTC](https://discourse.paraview.org/t/i-need-help-with-creating-3d-from-multiple-2d-profiles-of-electrical-resistivity-data/14387/1 "2024-04-11T20:31:29Z")
I need help creating 3D image like the one below out of 2D images. My data is a CSV file. The data structure consists of 4 columns - longitude latitude depth resistivity\_change. I can share a small part of my data is you request.
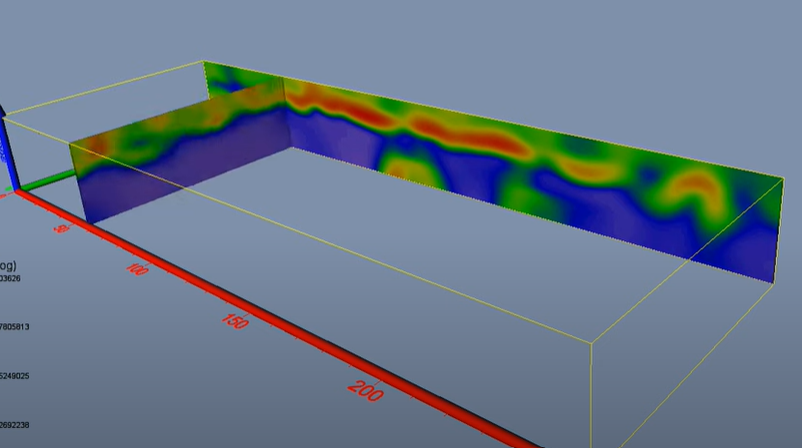.
This is what I have done so far
1. I uploaded my csv file
2. Filter-alphabet-Table to Points
3. On property, I specify my x,y,z and apply.
The result I got were series of points in a straight line.
---
### Author:  [@Francois\_Mazen](https://discourse.paraview.org/u/Francois_Mazen)
#### Post date: [April 12, 2024, 1:19pm UTC](https://discourse.paraview.org/t/i-need-help-with-creating-3d-from-multiple-2d-profiles-of-electrical-resistivity-data/14387/2 "2024-04-12T13:19:55Z")
Hi @Adetokunbo_Peter !
If you data are structured (i.e. you provide value for each cell in an i-j-k manner), you may use the Table to Structured Grid filter.
Otherwise, please share you data.
Best,
---
### Author:  [@Adetokunbo\_Peter](https://discourse.paraview.org/u/Adetokunbo_Peter)
#### Post date: [May 11, 2024, 1:02am UTC](https://discourse.paraview.org/t/i-need-help-with-creating-3d-from-multiple-2d-profiles-of-electrical-resistivity-data/14387/3 "2024-05-11T01:02:36Z")
[Line3dtest.csv](https://discourse.paraview.org/uploads/short-url/92dEOpMU0Q7VnNdnFD8Oji6yEE3.csv) (27.0 KB)
That’s a small part of my data. If the outcome is correct it will show two 2d image in 3d space.
I look forward to your help
---
### Author:  [@Kenichiro-Yoshimi](https://discourse.paraview.org/u/Kenichiro-Yoshimi)
#### Post date: [May 11, 2024, 12:37pm UTC](https://discourse.paraview.org/t/i-need-help-with-creating-3d-from-multiple-2d-profiles-of-electrical-resistivity-data/14387/4 "2024-05-11T12:37:17Z")
Initially, you might need to convert the latitude and longitude to an appropriate planar Cartesian coordinate system, similar to the example figure you presented in your initial post. Otherwise, the variations in latitude and longitude could be too minor compared to the depth scale, resulting in a straight line appearance.