# Is it possible to automatically graph data from a qt plugin?
**URL:** https://discourse.paraview.org/t/is-it-possible-to-automatically-graph-data-from-a-qt-plugin/6791
**Category:** ParaView Support
**Created:** [March 25, 2021, 6:47am UTC](https://discourse.paraview.org/t/is-it-possible-to-automatically-graph-data-from-a-qt-plugin/6791 "2021-03-25T06:47:13Z")
**Posts on this page:** 6
**Page:** 1
### Author:  [@anthomas](https://discourse.paraview.org/u/anthomas)
#### Post date: [March 25, 2021, 6:47am UTC](https://discourse.paraview.org/t/is-it-possible-to-automatically-graph-data-from-a-qt-plugin/6791/1 "2021-03-25T06:47:13Z")
I am trying to graph data that is being generated in real time with a paraview (5.8) plugin, the plugin is a gui to start generating this data. Is it possible to implement an outside filter within the plugin to plot to the main render view? I have not found a way to do this and have been trying to create a plot following examples with vtk, however several imports are not being found despite my efforts with the cmake file. Any help is appreciated.
---
### Author:  [@mwestphal](https://discourse.paraview.org/u/mwestphal)
#### Post date: [March 25, 2021, 9:18am UTC](https://discourse.paraview.org/t/is-it-possible-to-automatically-graph-data-from-a-qt-plugin/6791/2 "2021-03-25T09:18:18Z")
You may want to clarify the following:
1. What have you already implemeted, what it does and how it does it.
2. What do you want to achieve, with examples and screenshots if possible.
---
### Author:  [@anthomas](https://discourse.paraview.org/u/anthomas)
#### Post date: [March 25, 2021, 4:38pm UTC](https://discourse.paraview.org/t/is-it-possible-to-automatically-graph-data-from-a-qt-plugin/6791/3 "2021-03-25T16:38:12Z")
I have a plugin that is an implementation of the vtkCountCellVertices filter. So far it uses qt5 classes to create a simple gui that allows inputs and can connect to docker to execute commands on the input data via the terminal.
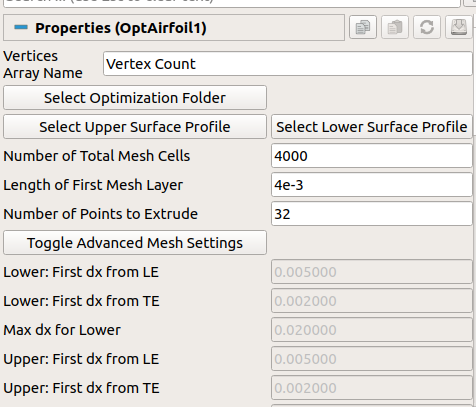
After defining the inputs one can run an optimization, while running terminal commands from the plugin (like the optimization command) paraview freezes. Running the terminal command asynchronously did not fix this, can it be resolved?
During the optimization, data will be returned in a log file. I want this data to be graphed, ideally in real time and in the main paraview viewing window, similar to the other plotting filters.
I am wondering if it is possible to use one of the plot filters automatically to plot to the main viewing screen? I could not find a way to do this, but I was able to create an extra window following an example with vtk render windows.
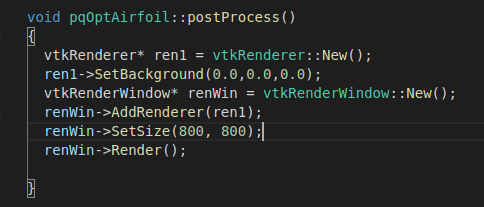
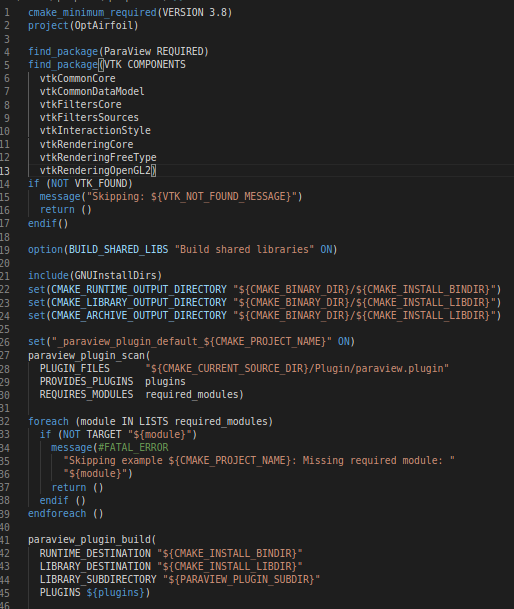
I have tried plotting to this window following vtk examples, however several of the classes used in the examples cannot be found when importing. I am seeming to only have issues with plot related vtk classes. I think this may be due to my cmake file:
A solution to automatically plotting data, if possible, would be much appreciated.
---
### Author:  [@mwestphal](https://discourse.paraview.org/u/mwestphal)
#### Post date: [March 30, 2021, 8:34am UTC](https://discourse.paraview.org/t/is-it-possible-to-automatically-graph-data-from-a-qt-plugin/6791/4 "2021-03-30T08:34:31Z")
> [@anthomas](#):
>
> After defining the inputs one can run an optimization, while running terminal commands from the plugin (like the optimization command) paraview freezes. Running the terminal command asynchronously did not fix this, can it be resolved?
ParaView computation freeze the interface, this is expected and there is no work around for this.
> A solution to automatically plotting data, if possible, would be much appreciated.
Just use ParaView mechanism of line chart view.
tbf your plugin seems very complex and I’d suggest professional support from a company like Kitware:
[https://www.kitware.com/](https://www.kitware.com/)
---
### Author:  [@anthomas](https://discourse.paraview.org/u/anthomas)
#### Post date: [April 8, 2021, 6:20pm UTC](https://discourse.paraview.org/t/is-it-possible-to-automatically-graph-data-from-a-qt-plugin/6791/5 "2021-04-08T18:20:24Z")
-ParaView computations freeze the interface, however when calling docker asynchronously using QtConcurrent I was able to bypass that issue.
-The data is now being fed into the pipeline, can this be refreshed on an interval and have the render view properties altered from within the plugin?
-Would you recommend a separate library for automated plotting?
---
### Author:  [@anthomas](https://discourse.paraview.org/u/anthomas)
#### Post date: [April 14, 2021, 9:35pm UTC](https://discourse.paraview.org/t/is-it-possible-to-automatically-graph-data-from-a-qt-plugin/6791/6 "2021-04-14T21:35:16Z")
Update: I was able to import the matplotlibcpp module and call it with QtConcurrent to generate plots. A solution within paraview would still be appreciated for a more streamlined method.