# is this possible to generate the avg value over the line plot?
**URL:** https://discourse.paraview.org/t/is-this-possible-to-generate-the-avg-value-over-the-line-plot/13065
**Category:** ParaView Support
**Created:** [October 19, 2023, 1:33pm UTC](https://discourse.paraview.org/t/is-this-possible-to-generate-the-avg-value-over-the-line-plot/13065 "2023-10-19T13:33:48Z")
**Posts on this page:** 6
**Page:** 1
### Author:  [@Chhotelal](https://discourse.paraview.org/u/Chhotelal)
#### Post date: [October 19, 2023, 1:33pm UTC](https://discourse.paraview.org/t/is-this-possible-to-generate-the-avg-value-over-the-line-plot/13065/1 "2023-10-19T13:33:48Z")
can I get the average value (one value) of each line plot in para view? I want to create a line spatially like (0.5, 0.10, 0.20, …1) and create a line plot over the line, I want to generate the average value of each spatial line and plot axially. is it possible in the para view?
Also, I want to get the multiple-line plot in one window, then what are the steps?
---
### Author:  [@mwestphal](https://discourse.paraview.org/u/mwestphal)
#### Post date: [October 23, 2023, 9:45am UTC](https://discourse.paraview.org/t/is-this-possible-to-generate-the-avg-value-over-the-line-plot/13065/2 "2023-10-23T09:45:45Z")
You can create as many lines as you want, group them using GroupDataSet and then use PlotOverLineFromCustomSource or RessampleWithDataSet to recover the data, then display the result in a chart.
To compute an average value, you can use DescriptiveStatistics on the RessampleWithDataSet
---
### Author:  [@Chhotelal](https://discourse.paraview.org/u/Chhotelal)
#### Post date: [October 24, 2023, 1:40pm UTC](https://discourse.paraview.org/t/is-this-possible-to-generate-the-avg-value-over-the-line-plot/13065/3 "2023-10-24T13:40:20Z")
Could you do the same things in paraview ( data strem picture) thta is easy way to understand.
---
### Author:  [@mwestphal](https://discourse.paraview.org/u/mwestphal)
#### Post date: [October 24, 2023, 1:45pm UTC](https://discourse.paraview.org/t/is-this-possible-to-generate-the-avg-value-over-the-line-plot/13065/4 "2023-10-24T13:45:49Z")
please share your data
---
### Author:  [@Chhotelal](https://discourse.paraview.org/u/Chhotelal)
#### Post date: [October 25, 2023, 9:42am UTC](https://discourse.paraview.org/t/is-this-possible-to-generate-the-avg-value-over-the-line-plot/13065/5 "2023-10-25T09:42:55Z")
The total time zip file is too large and is not accessible to upload here so I attached only some time step files kindly check the zip file herewith.
[INTER\_DOMAIN\_0603.zip](https://discourse.paraview.org/uploads/short-url/j1mLwTnIUZyTBNZMcg7wuJzWuMR.zip) (1.4 MB)
---
### Author:  [@mwestphal](https://discourse.paraview.org/u/mwestphal)
#### Post date: [October 25, 2023, 1:20pm UTC](https://discourse.paraview.org/t/is-this-possible-to-generate-the-avg-value-over-the-line-plot/13065/6 "2023-10-25T13:20:08Z")
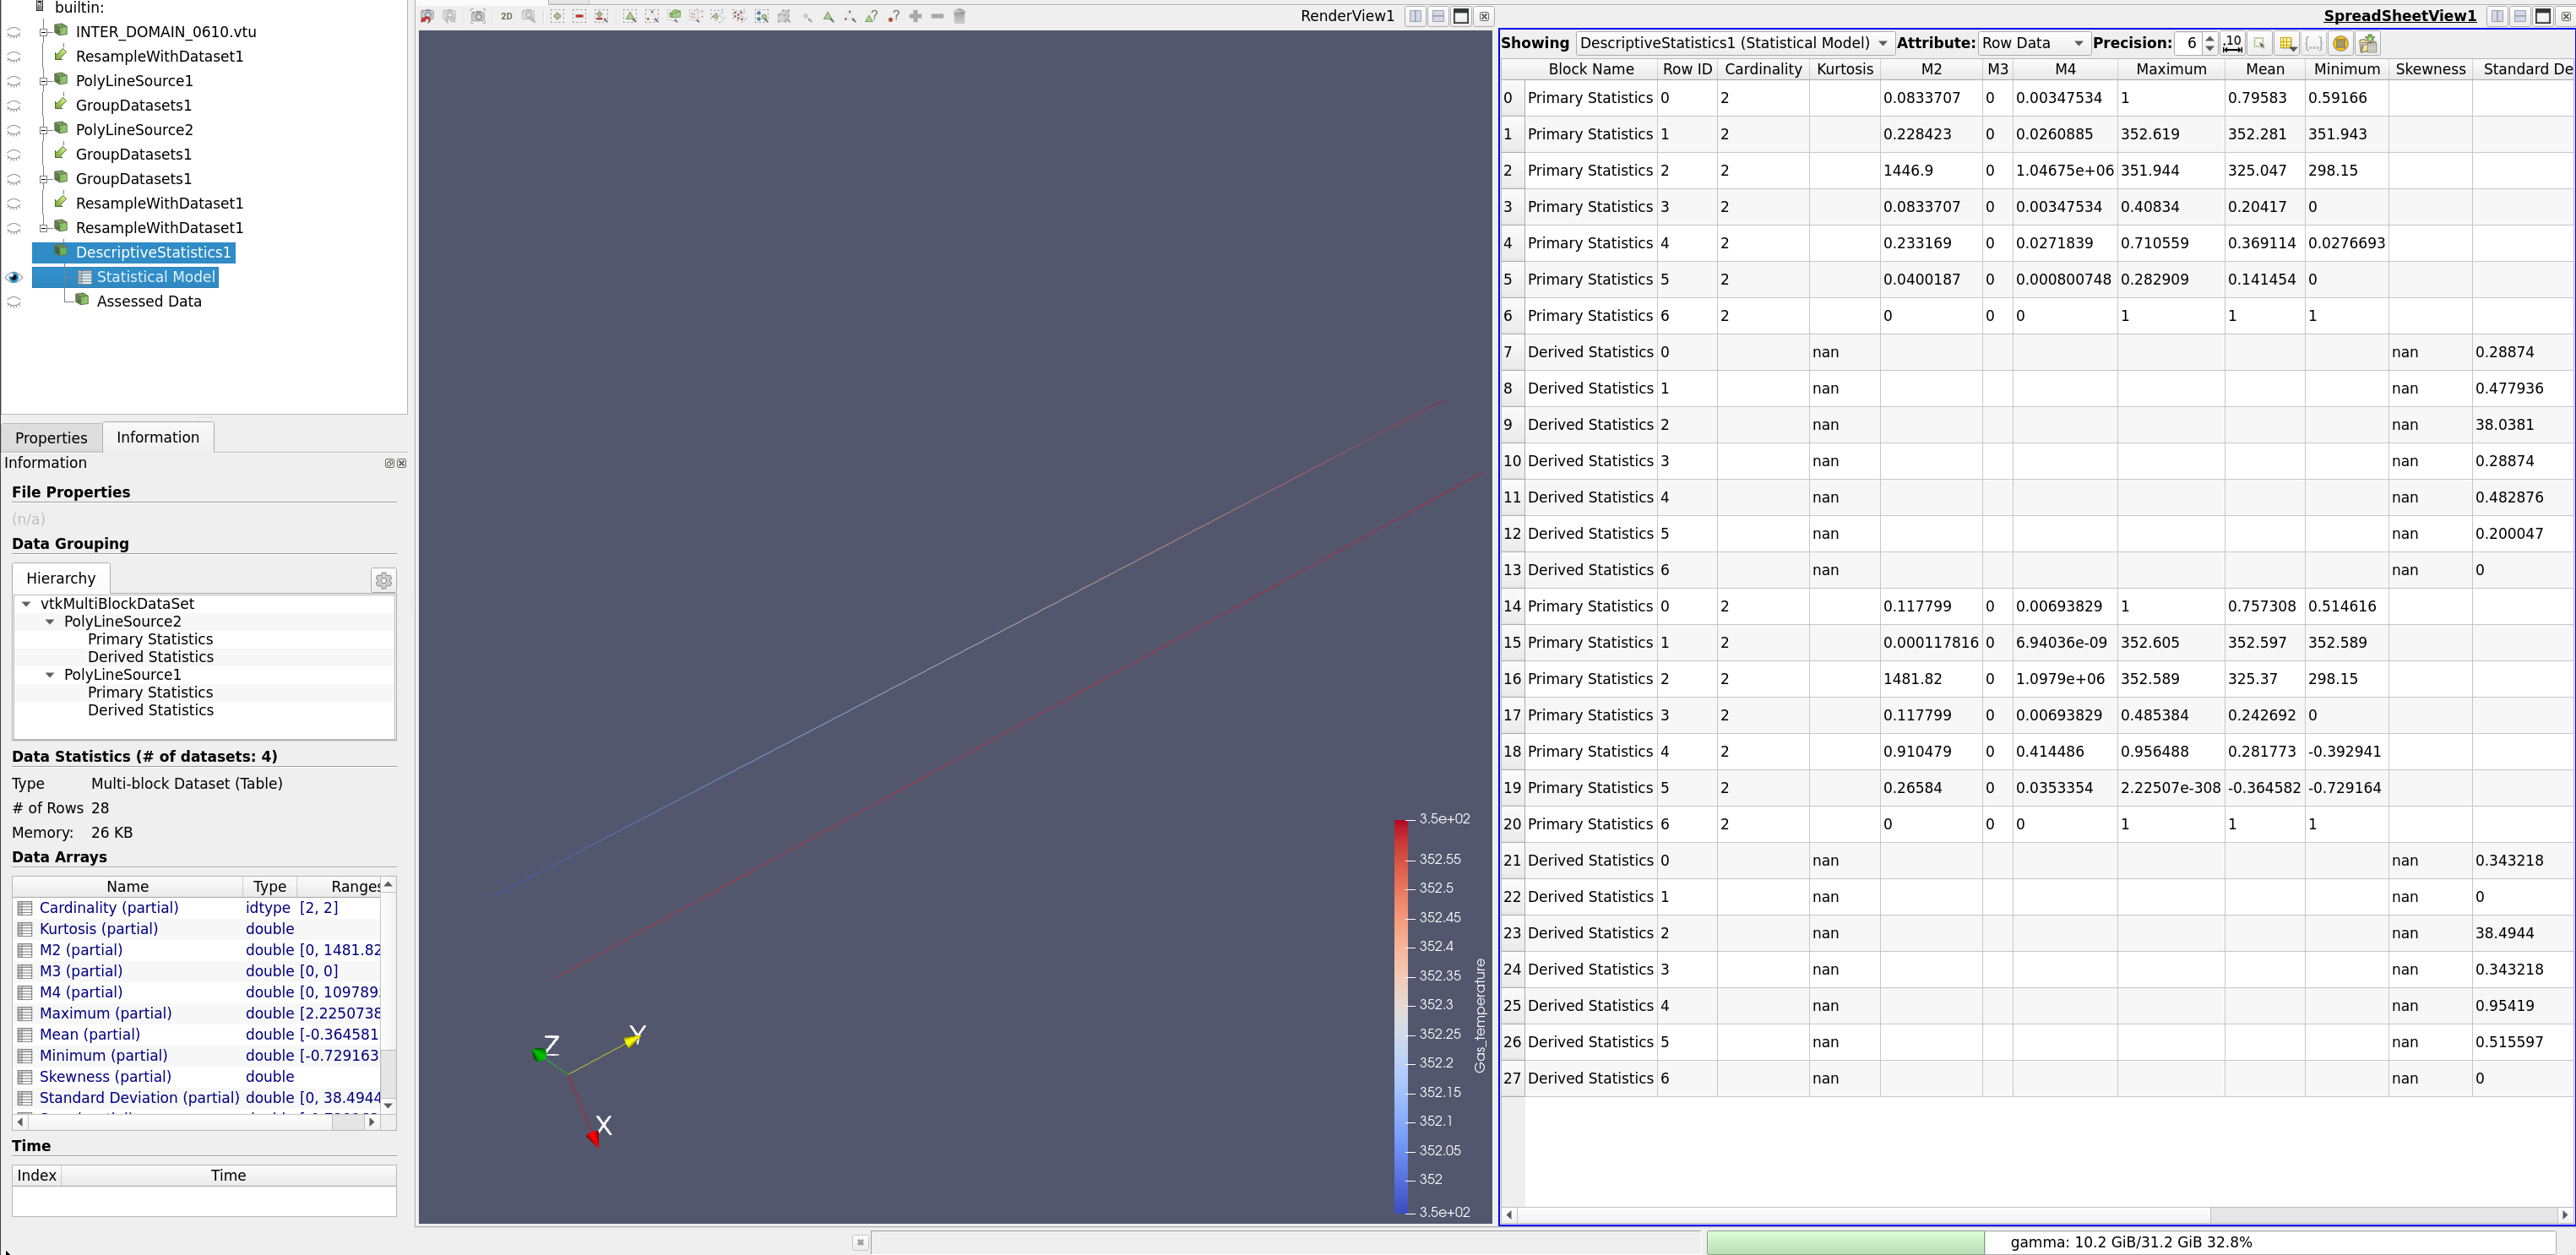
[state.pvsm](https://discourse.paraview.org/uploads/short-url/sPsPgbQ8WIerVF4mWaodYuqokPR.pvsm) (682.6 KB)