# Is this possible to plot one point representing the average for n points instead of all points
**URL:** https://discourse.paraview.org/t/is-this-possible-to-plot-one-point-representing-the-average-for-n-points-instead-of-all-points/8625
**Category:** ParaView Support
**Created:** [December 14, 2021, 11:39pm UTC](https://discourse.paraview.org/t/is-this-possible-to-plot-one-point-representing-the-average-for-n-points-instead-of-all-points/8625 "2021-12-14T23:39:44Z")
**Posts on this page:** 20
**Page:** 1
### Author:  [@Butanium](https://discourse.paraview.org/u/Butanium)
#### Post date: [December 14, 2021, 11:39pm UTC](https://discourse.paraview.org/t/is-this-possible-to-plot-one-point-representing-the-average-for-n-points-instead-of-all-points/8625/1 "2021-12-14T23:39:44Z")
Hello,
I’m making a project in which I have a huge CSV (~1M entries) representing timestamp and length. Plotting it with no processing is unreadable :
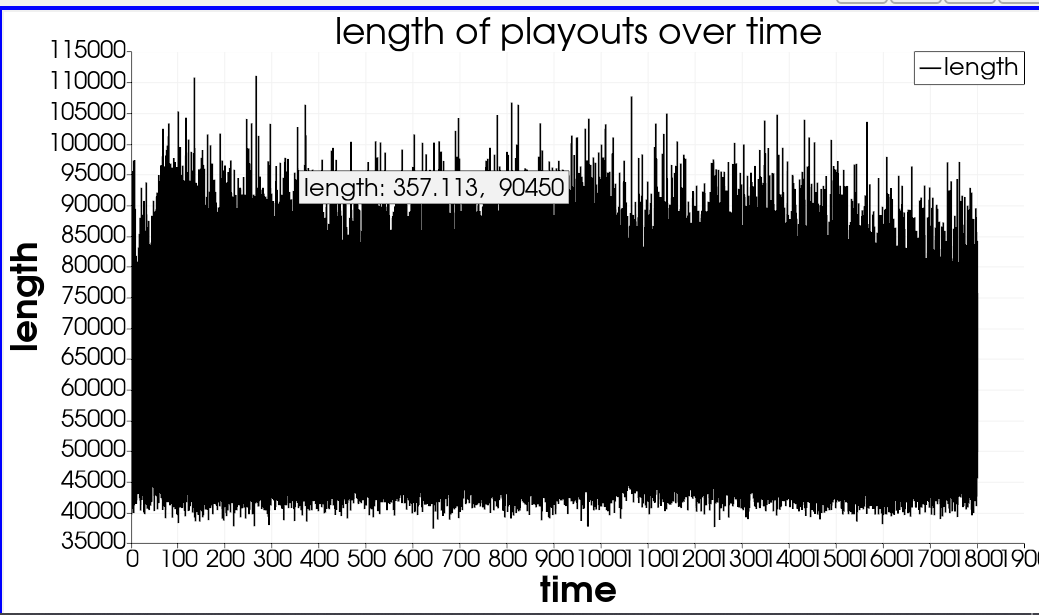
I already made some test with python and Matplotlib and if instead of plotting all points I plot 1 point for 1000 at the average timestamp with the average length of the 1000 points, the graphic can actually be exploited.
Can I do this in Paraview or do I have to use external tools ?
---
### Author:  [@mwestphal](https://discourse.paraview.org/u/mwestphal)
#### Post date: [December 16, 2021, 9:07am UTC](https://discourse.paraview.org/t/is-this-possible-to-plot-one-point-representing-the-average-for-n-points-instead-of-all-points/8625/2 "2021-12-16T09:07:15Z")
Working with table, this does not seem possible atm. If your data contains geometrical points, this would be possible.
@utkarsh.ayachit : This would have been possible with Query in FindData.
---
### Author:  [@Butanium](https://discourse.paraview.org/u/Butanium)
#### Post date: [December 27, 2021, 9:18am UTC](https://discourse.paraview.org/t/is-this-possible-to-plot-one-point-representing-the-average-for-n-points-instead-of-all-points/8625/3 "2021-12-27T09:18:07Z")
Hey, sorry for the late reply. What do you mean by geometrical points ?
---
### Author:  [@mwestphal](https://discourse.paraview.org/u/mwestphal)
#### Post date: [December 27, 2021, 10:10am UTC](https://discourse.paraview.org/t/is-this-possible-to-plot-one-point-representing-the-average-for-n-points-instead-of-all-points/8625/4 "2021-12-27T10:10:10Z")
There is a decimate filter in ParaView but it works only on geometrical data (vtkPolyData) not on pure table (vtkTable). you could convert your data to polydata though.
---
### Author:  [@Butanium](https://discourse.paraview.org/u/Butanium)
#### Post date: [December 27, 2021, 10:25am UTC](https://discourse.paraview.org/t/is-this-possible-to-plot-one-point-representing-the-average-for-n-points-instead-of-all-points/8625/5 "2021-12-27T10:25:30Z")
The data are stored in a csv file like this :
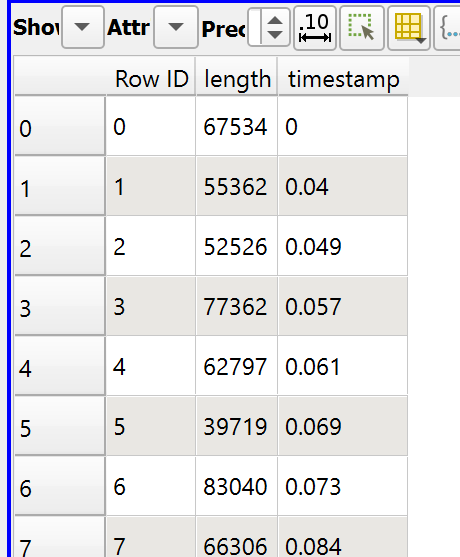
Which filter should I use in order to convert them in vtkPolyData ?
---
### Author:  [@mwestphal](https://discourse.paraview.org/u/mwestphal)
#### Post date: [December 27, 2021, 10:30am UTC](https://discourse.paraview.org/t/is-this-possible-to-plot-one-point-representing-the-average-for-n-points-instead-of-all-points/8625/6 "2021-12-27T10:30:00Z")
TableToPoints
---
### Author:  [@Butanium](https://discourse.paraview.org/u/Butanium)
#### Post date: [December 27, 2021, 1:43pm UTC](https://discourse.paraview.org/t/is-this-possible-to-plot-one-point-representing-the-average-for-n-points-instead-of-all-points/8625/7 "2021-12-27T13:43:30Z")
Unfortunately, as my Y axis is way bigger than my X axis, so I get this result :
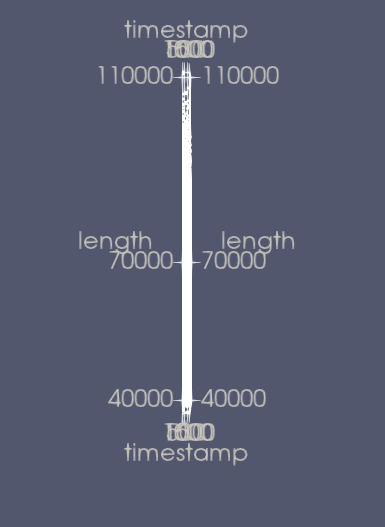
Is this possible to make the coordinate system non orthonormal ?
By the way here is the csv file if you want to try it on your side. I can’t upload it here so here is the [google drive link](https://drive.google.com/file/d/17NYXszJI5ett9GfiFo4519j75ZZNV3eS/view?usp=sharing)
---
### Author:  [@mwestphal](https://discourse.paraview.org/u/mwestphal)
#### Post date: [December 27, 2021, 3:19pm UTC](https://discourse.paraview.org/t/is-this-possible-to-plot-one-point-representing-the-average-for-n-points-instead-of-all-points/8625/8 "2021-12-27T15:19:24Z")
Using Decimate + PlotData should give you the results you are looking for.
If not, please share your data.
---
### Author:  [@Butanium](https://discourse.paraview.org/u/Butanium)
#### Post date: [January 17, 2022, 2:51pm UTC](https://discourse.paraview.org/t/is-this-possible-to-plot-one-point-representing-the-average-for-n-points-instead-of-all-points/8625/9 "2022-01-17T14:51:46Z")
I can’t use the decimate filter I got :
`ERROR: In C:\glr\builds\paraview\paraview-ci\build\superbuild\paraview\src\VTK\Filters\Core\vtkDecimatePro.cxx, line 160 vtkDecimatePro (000002CD91D56380): No data to decimate!`
1 :
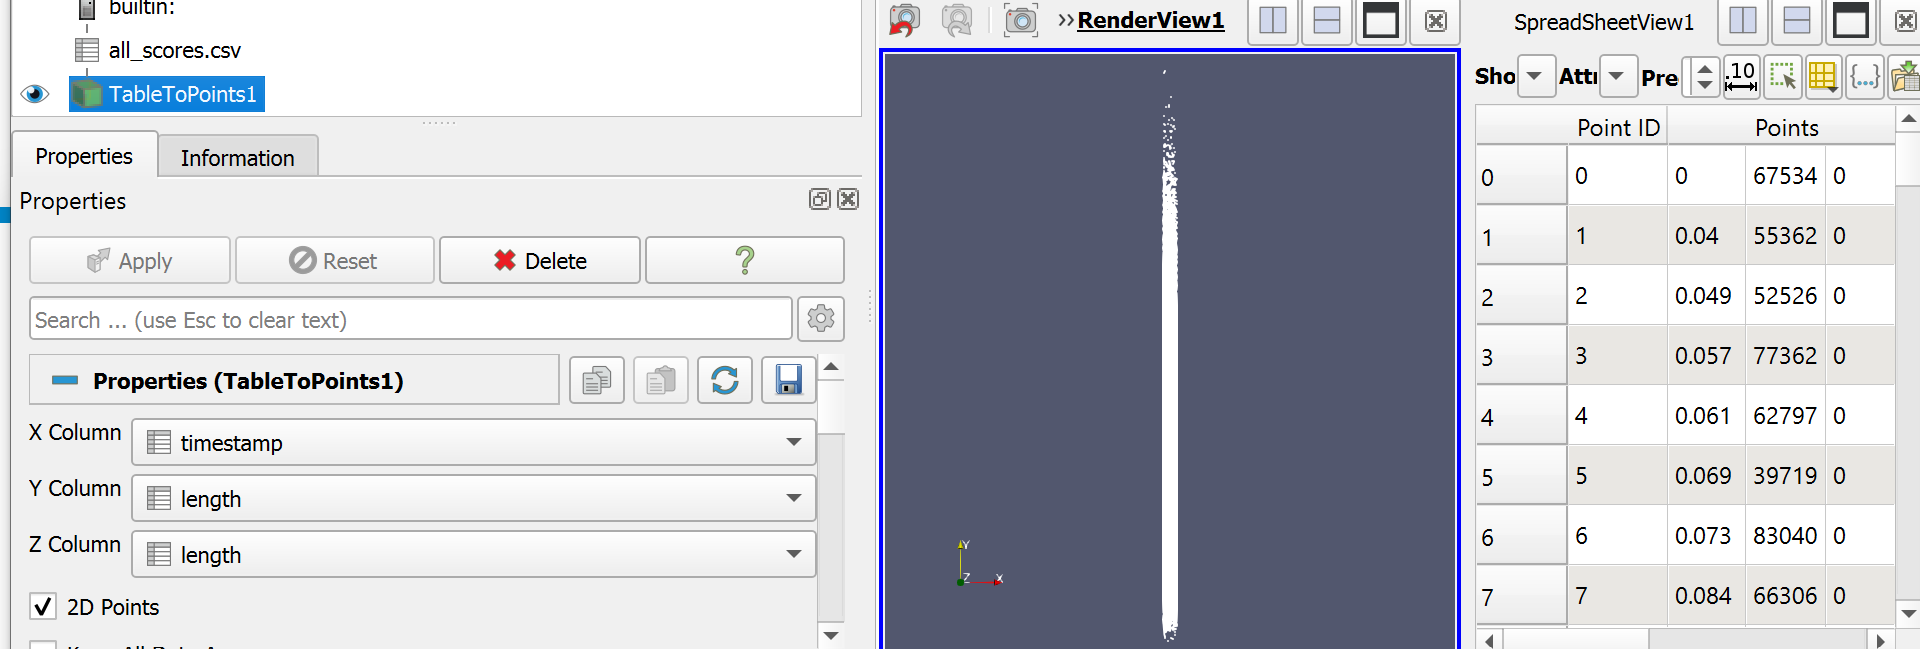
2 :
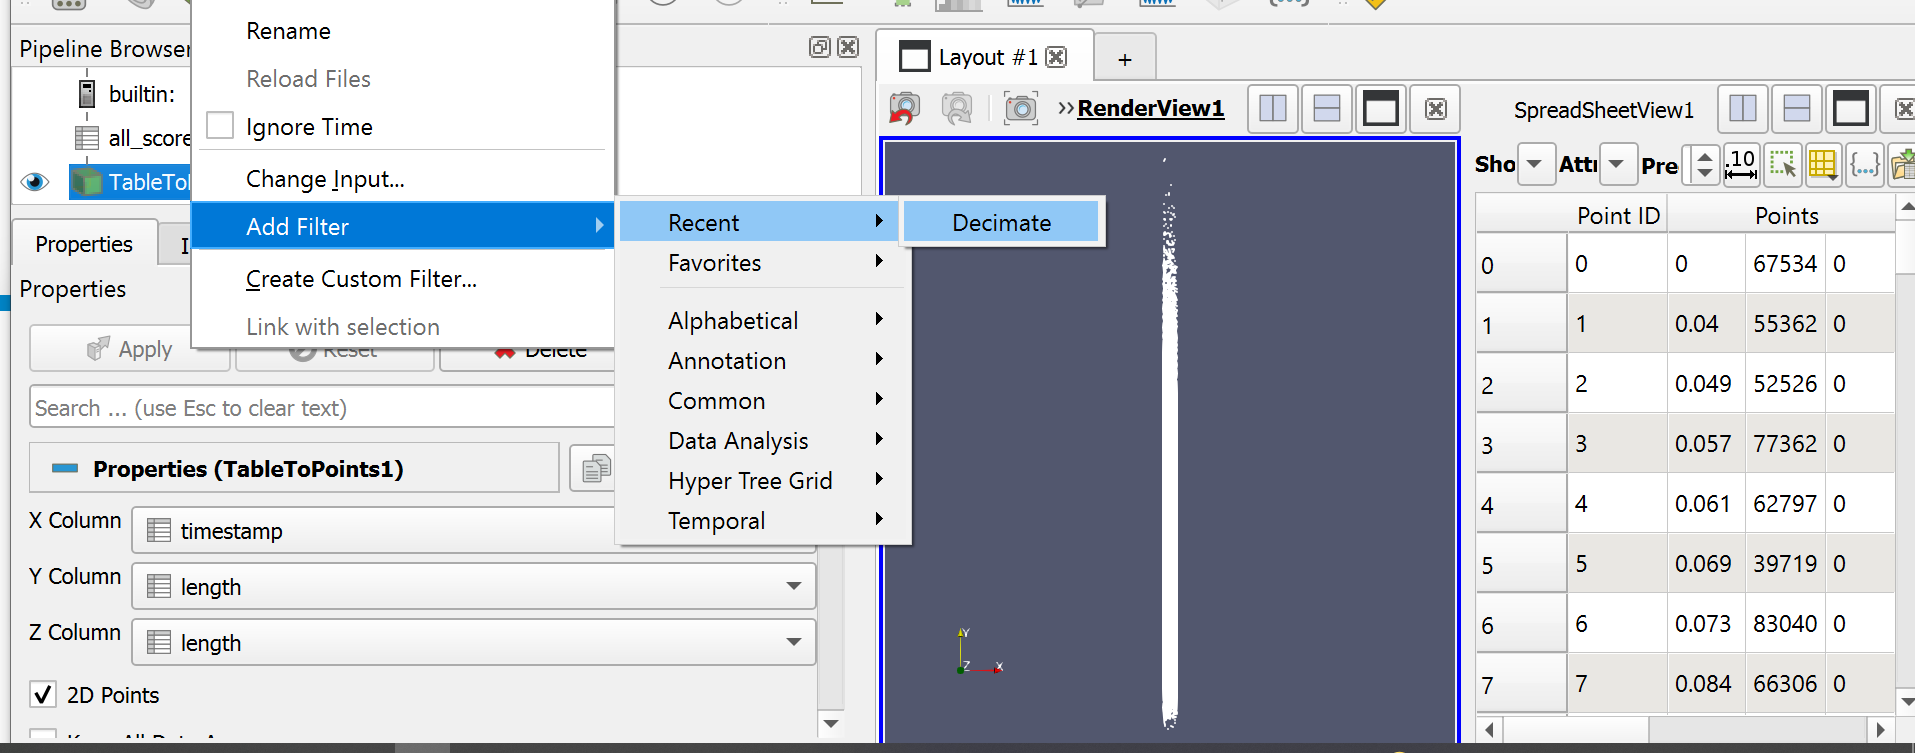
3 :
[[Album] error paraview 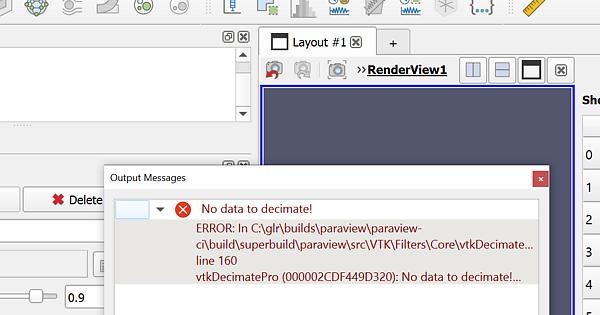 ](https://imgur.com/a/MflA57D)
My data can be accessed here : [all\_scores.csv - Google Drive](https://drive.google.com/file/d/17NYXszJI5ett9GfiFo4519j75ZZNV3eS/view?usp=sharing)
---
### Author:  [@mwestphal](https://discourse.paraview.org/u/mwestphal)
#### Post date: [January 17, 2022, 2:58pm UTC](https://discourse.paraview.org/t/is-this-possible-to-plot-one-point-representing-the-average-for-n-points-instead-of-all-points/8625/10 "2022-01-17T14:58:41Z")
You need to add a Delaunay3D and a ExtractSurface filter to be able to use the Decimate filter, but this is getting a bit a ridiculous work around.
At that point I would just create a simple programmable filter for this decimation.
---
### Author:  [@Butanium](https://discourse.paraview.org/u/Butanium)
#### Post date: [January 17, 2022, 9:37pm UTC](https://discourse.paraview.org/t/is-this-possible-to-plot-one-point-representing-the-average-for-n-points-instead-of-all-points/8625/11 "2022-01-17T21:37:37Z")
To do this, do I have to read the .csv inside my python script, or can I use the `plot data` object generated by paraview ? As I have a lot of points I fear that reading the csv with python will take too long
---
### Author:  [@Butanium](https://discourse.paraview.org/u/Butanium)
#### Post date: [January 17, 2022, 9:59pm UTC](https://discourse.paraview.org/t/is-this-possible-to-plot-one-point-representing-the-average-for-n-points-instead-of-all-points/8625/12 "2022-01-17T21:59:11Z")
I used a programmable source :
```python
import numpy as np
# assuming data.csv is a CSV file with the 1st row being the names names for
# the columns
data = np.genfromtxt("C:/Users/Clement/Documents/prepa/tipe/ocaml-tsp/logs/MCTS-att48-1800s-Random-Min_spanning_tree-Two_opt_optimization_200len_100iter_1s--1/all_scores.csv", dtype=None, names=True, delimiter=',', autostrip=True)
for name in data.dtype.names:
a = np.array(data[name])
m = 1000
b=a[:len(a)//m*m].reshape(-1, m).mean(1)
# You can directly pass a NumPy array to the pipeline.
# Since ParaView expects all arrays to be named, you
# need to assign it a name in the 'append' call.
output.RowData.append(b, name)
```
I don’t know how I can use the csv file inside paraview as an input I guess it would be with a programmable filter ? This would be better than just manually writing the path to the file as I did. Also, it would be nice if m was a parameter for the filter
---
### Author:  [@mwestphal](https://discourse.paraview.org/u/mwestphal)
#### Post date: [January 19, 2022, 5:53pm UTC](https://discourse.paraview.org/t/is-this-possible-to-plot-one-point-representing-the-average-for-n-points-instead-of-all-points/8625/13 "2022-01-19T17:53:48Z")
> [@Butanium](#):
>
> I don’t know how I can use the csv file inside paraview as an input I guess it would be with a programmable filter
Correct
> Also, it would be nice if m was a parameter for the filter
That is possible with a python plugin
---
### Author:  [@Butanium](https://discourse.paraview.org/u/Butanium)
#### Post date: [January 26, 2022, 9:56am UTC](https://discourse.paraview.org/t/is-this-possible-to-plot-one-point-representing-the-average-for-n-points-instead-of-all-points/8625/14 "2022-01-26T09:56:03Z")
I’m looking at [util.vtkAlgorithm Module — ParaView/Python 5.10.0 documentation](https://kitware.github.io/paraview-docs/latest/python/paraview.util.vtkAlgorithm.html) to try to understand how to make my plugin
```auto
@smproperty.intvector(name="ReductionFactor", default_values=16)
def SetReductionFactor(self, x):
if x <= 0:
print("Error : the reduction factor has to be a greater or equal to 1")
raise Exception("the reduction factor has to be a greater or equal to 1")
self._realAlgorithm.SetReductionFactor(x)
self.Modified()
```
How can I get the `ReductionFactor` when `RequestData` is called ?
Also here is my current code [Python plugin paraview - Pastebin.com](https://pastebin.com/zgjwpe7B) (not using the ReductionFactor for now). For now when I try to import it I get this error :
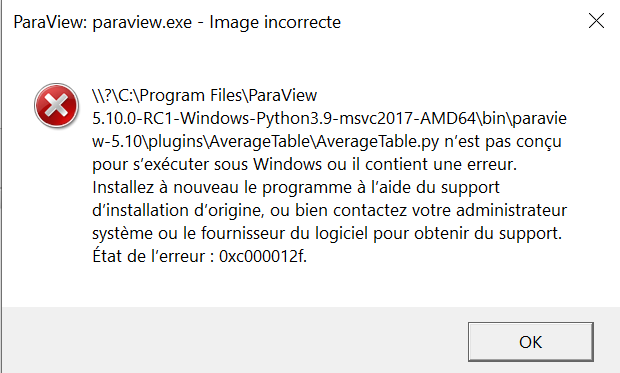
---
### Author:  [@pavel](https://discourse.paraview.org/u/pavel)
#### Post date: [January 26, 2022, 10:09am UTC](https://discourse.paraview.org/t/is-this-possible-to-plot-one-point-representing-the-average-for-n-points-instead-of-all-points/8625/15 "2022-01-26T10:09:08Z")
Hi!
You need to add the line:
> from paraview.util.vtkAlgorithm import \*
in the beginning of your plugin code:
> from paraview.util.vtkAlgorithm import \*
>
> @smproxy.filter()
> @smproperty.input(name=“InputTable”)
> @smdomain.datatype(dataTypes=[“vtkTable”], port\_index=1, composite\_data\_supported=False)
> …
Best Regards,
Pavel
---
### Author:  [@Butanium](https://discourse.paraview.org/u/Butanium)
#### Post date: [January 26, 2022, 1:17pm UTC](https://discourse.paraview.org/t/is-this-possible-to-plot-one-point-representing-the-average-for-n-points-instead-of-all-points/8625/16 "2022-01-26T13:17:55Z")
> [@pavel](#):
>
> from paraview.util.vtkAlgorithm import \*
Thanks, now I get I new error :
```py
Generic Warning: In C:\glr\builds\paraview\paraview-ci\build\superbuild\paraview\src\Remoting\ServerManagerPython\vtkPVPythonAlgorithmPlugin.cxx, line 184
Failed to load Python plugin:
Failed to call `paraview.detail.pythonalgorithm.load_plugin`.
Traceback (most recent call last):
File "C:\Program Files\ParaView 5.10.0-RC1-Windows-Python3.9-msvc2017-AMD64\bin\Lib\site-packages\paraview\detail\pythonalgorithm.py", line 509, in load_plugin
spec.loader.exec_module(module)
File "", line 855, in exec_module
File "", line 228, in _call_with_frames_removed
File "C:\Program Files\ParaView 5.10.0-RC1-Windows-Python3.9-msvc2017-AMD64\bin\paraview-5.10\plugins\AverageTable\AverageTable.py", line 2, in
@smproxy.filter()
NameError: name 'smproxy' is not defined
ERROR: In C:\glr\builds\paraview\paraview-ci\build\superbuild\paraview\src\Remoting\Core\vtkPVPluginLoader.cxx, line 532
vtkPVPluginLoader (000001F652730CC0): C:\Program Files\ParaView 5.10.0-RC1-Windows-Python3.9-msvc2017-AMD64\bin\paraview-5.10\plugins\AverageTable\AverageTable.py: %1 n’est pas une application Win32 valide.
```
---
### Author:  [@pavel](https://discourse.paraview.org/u/pavel)
#### Post date: [January 26, 2022, 1:52pm UTC](https://discourse.paraview.org/t/is-this-possible-to-plot-one-point-representing-the-average-for-n-points-instead-of-all-points/8625/17 "2022-01-26T13:52:54Z")
Could you please clarify when do you have this error? Immediately after attempt to import plugin through ParaView GUI (Tools-\>Manage Plugins…-\>Plugin Manager-\>Load New …)? Or did you add this plugin to a list of autoload plugins?
---
### Author:  [@pavel](https://discourse.paraview.org/u/pavel)
#### Post date: [January 26, 2022, 2:15pm UTC](https://discourse.paraview.org/t/is-this-possible-to-plot-one-point-representing-the-average-for-n-points-instead-of-all-points/8625/18 "2022-01-26T14:15:35Z")
By the way, what do you want to view in ParaView? Just a set of points (x\_i = t\_i, y\_i = length\_i according your csv file) with the possibility to merge every m (e.g. m = 1000) points with averaged length? For this you can use python libraries (e.g. for signal processing) to decimate the signal inside your plugin for ParaView or inside other python script before loading the data into the ParaView. Why do you not use precompiled binaries of stable version of ParaView?
---
### Author:  [@Butanium](https://discourse.paraview.org/u/Butanium)
#### Post date: [January 26, 2022, 2:55pm UTC](https://discourse.paraview.org/t/is-this-possible-to-plot-one-point-representing-the-average-for-n-points-instead-of-all-points/8625/19 "2022-01-26T14:55:51Z")
I used `load new`
---
### Author:  [@Butanium](https://discourse.paraview.org/u/Butanium)
#### Post date: [January 26, 2022, 3:03pm UTC](https://discourse.paraview.org/t/is-this-possible-to-plot-one-point-representing-the-average-for-n-points-instead-of-all-points/8625/20 "2022-01-26T15:03:13Z")
Yes this is what I’m trying to achieve. I just don’t know how to do it properly. I guess I could use scipy.signal.decimate for example. I’d like to do it in paraview because I prefer an overlay in which I can select the downsampling factor rather than a python script. If you have a code ready to use that would be awesome.
Also if there is a precompiled binary that does this it would be enough for me xD
[Next page](https://discourse.paraview.org/t/is-this-possible-to-plot-one-point-representing-the-average-for-n-points-instead-of-all-points/8625.md?page=2)