# Issue with interpolation of openfoam results?
**URL:** https://discourse.paraview.org/t/issue-with-interpolation-of-openfoam-results/13794
**Category:** ParaView Support
**Created:** [January 25, 2024, 3:46pm UTC](https://discourse.paraview.org/t/issue-with-interpolation-of-openfoam-results/13794 "2024-01-25T15:46:33Z")
**Posts on this page:** 4
**Page:** 1
### Author:  [@tomLauriks](https://discourse.paraview.org/u/tomLauriks)
#### Post date: [January 25, 2024, 3:46pm UTC](https://discourse.paraview.org/t/issue-with-interpolation-of-openfoam-results/13794/1 "2024-01-25T15:46:33Z")
I have the result of an openfoam model. I made both a slice and a plane as a source, subsequently the filter resample with data set.
When I show the results of a scalar (concentration) on the slice or plane, I see weird lines when I use the interpolated values
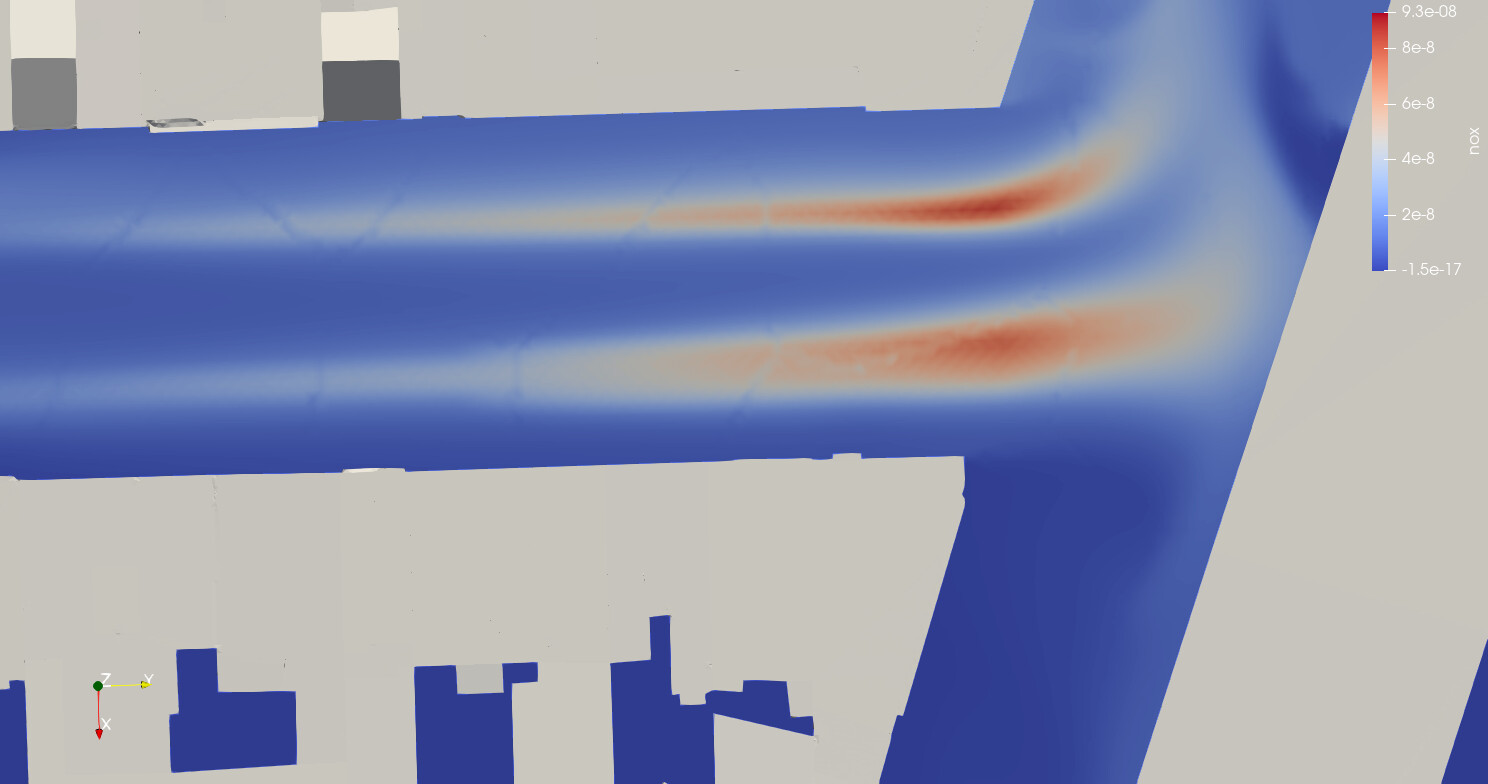.
When I use the cell center values, I do not see the lines
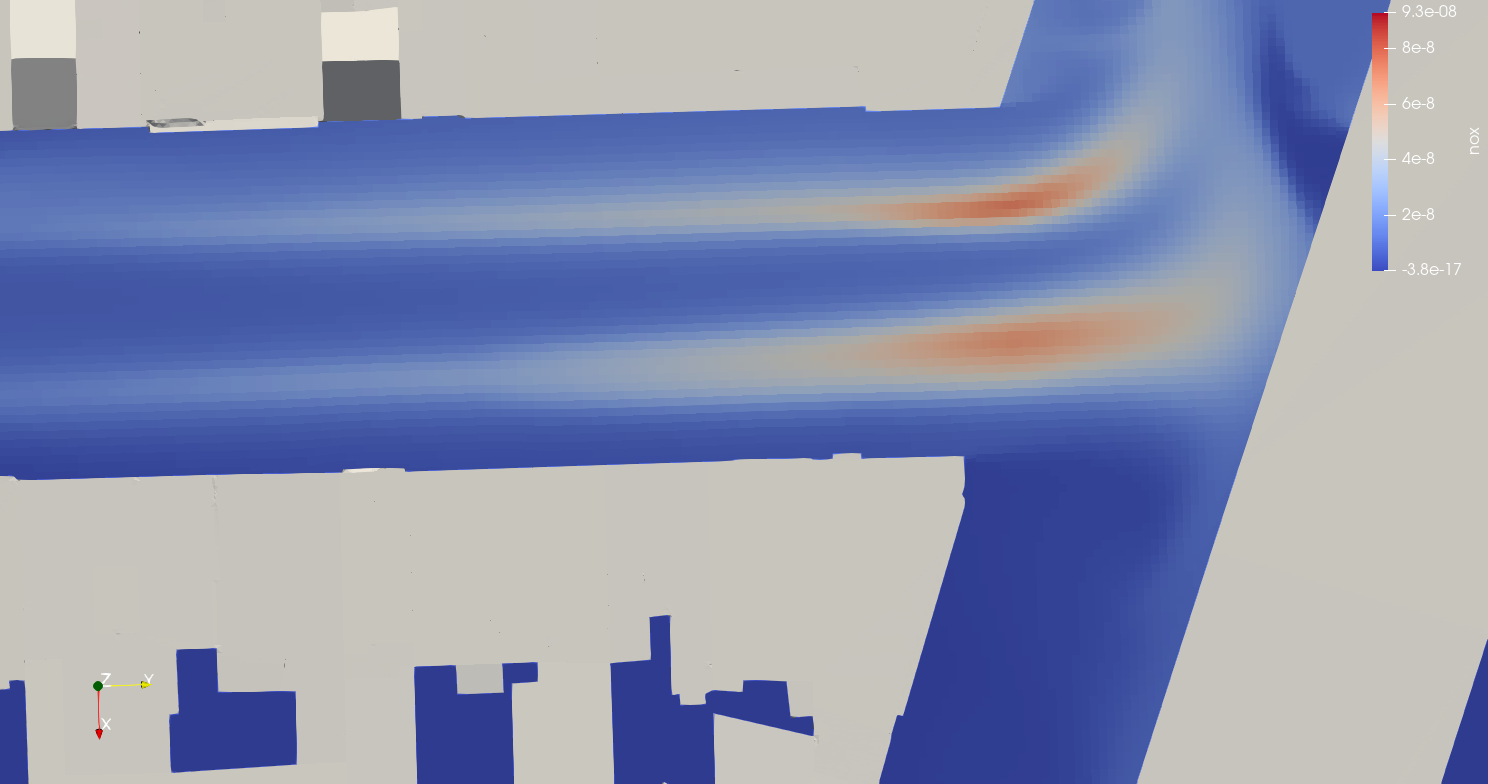
Could this be an interpolation issue and if yes, how can I solve it?
---
### Author:  [@tomLauriks](https://discourse.paraview.org/u/tomLauriks)
#### Post date: [January 26, 2024, 1:28pm UTC](https://discourse.paraview.org/t/issue-with-interpolation-of-openfoam-results/13794/2 "2024-01-26T13:28:04Z")
It might be useful to add that my domain has about 80e6 cells and that it is decomposed into approx. 1500 parts. I’m thinking that maybe the lines are on the borders of the domain parts.
---
### Author:  [@Francois\_Mazen](https://discourse.paraview.org/u/Francois_Mazen)
#### Post date: [January 29, 2024, 7:55am UTC](https://discourse.paraview.org/t/issue-with-interpolation-of-openfoam-results/13794/3 "2024-01-29T07:55:06Z")
HI @tomLauriks
Yes it looks like an interpolation schema. According to your screenshot, I would say the first one is point data and the second is cell data. You may use the Point Data to Cell Data filter to get the same result.
Where are located the input data, cell or point? And what is the magnitude of the error?
Best,
---
### Author:  [@tomLauriks](https://discourse.paraview.org/u/tomLauriks)
#### Post date: [January 29, 2024, 2:53pm UTC](https://discourse.paraview.org/t/issue-with-interpolation-of-openfoam-results/13794/4 "2024-01-29T14:53:04Z")
Hi François,
thanks for your reply!
My input data is cell data. If you mean by error, the difference between the value on the erroneous line and what that value should be, then I estimate between 25 and 66%.
I extracted the processor boundaries and visualized them in paraview. The lines in the interpolated point data do indeed coincide with processor boundaries.
Best,
Tom