# line borders for 2 different plots, how to make them the same.
**URL:** https://discourse.paraview.org/t/line-borders-for-2-different-plots-how-to-make-them-the-same/14531
**Category:** ParaView Support
**Created:** [May 1, 2024, 2:24am UTC](https://discourse.paraview.org/t/line-borders-for-2-different-plots-how-to-make-them-the-same/14531 "2024-05-01T02:24:48Z")
**Posts on this page:** 7
**Page:** 1
### Author:  [@ABCplotCBA](https://discourse.paraview.org/u/ABCplotCBA)
#### Post date: [May 1, 2024, 2:24am UTC](https://discourse.paraview.org/t/line-borders-for-2-different-plots-how-to-make-them-the-same/14531/1 "2024-05-01T02:24:48Z")
Hi all,
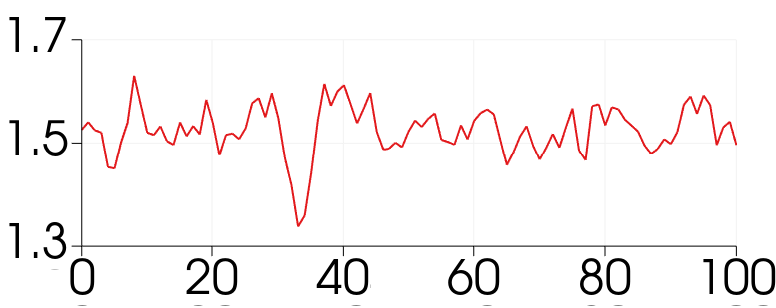
I have 2 linear plots from 2 different value, and I plan to compare them, but as x- axis does not match (due to font or the left axis values).
Is it possible to adjust both x-axis in 2 plots.
Cheers

---
### Author:  [@mwestphal](https://discourse.paraview.org/u/mwestphal)
#### Post date: [May 2, 2024, 7:47am UTC](https://discourse.paraview.org/t/line-borders-for-2-different-plots-how-to-make-them-the-same/14531/2 "2024-05-02T07:47:22Z")
please share your data
---
### Author:  [@ABCplotCBA](https://discourse.paraview.org/u/ABCplotCBA)
#### Post date: [May 7, 2024, 5:42am UTC](https://discourse.paraview.org/t/line-borders-for-2-different-plots-how-to-make-them-the-same/14531/3 "2024-05-07T05:42:00Z")
Thanks Mathieu.
Attached please find the data (BT data from btll1,csv, Ap1t data from Ap1t.csv.)
I saved both images as the size of 700x300 for example.
[Ap1t.csv](https://discourse.paraview.org/uploads/short-url/egIUhcr4WxhgHjdNn7xcp7H3ZDp.csv) (19.6 KB)
[btll1.csv](https://discourse.paraview.org/uploads/short-url/6qXculTvjiIxgyYQiiBHFkUaSQr.csv) (4.8 KB)
---
### Author:  [@mwestphal](https://discourse.paraview.org/u/mwestphal)
#### Post date: [May 7, 2024, 7:36am UTC](https://discourse.paraview.org/t/line-borders-for-2-different-plots-how-to-make-them-the-same/14531/4 "2024-05-07T07:36:18Z")
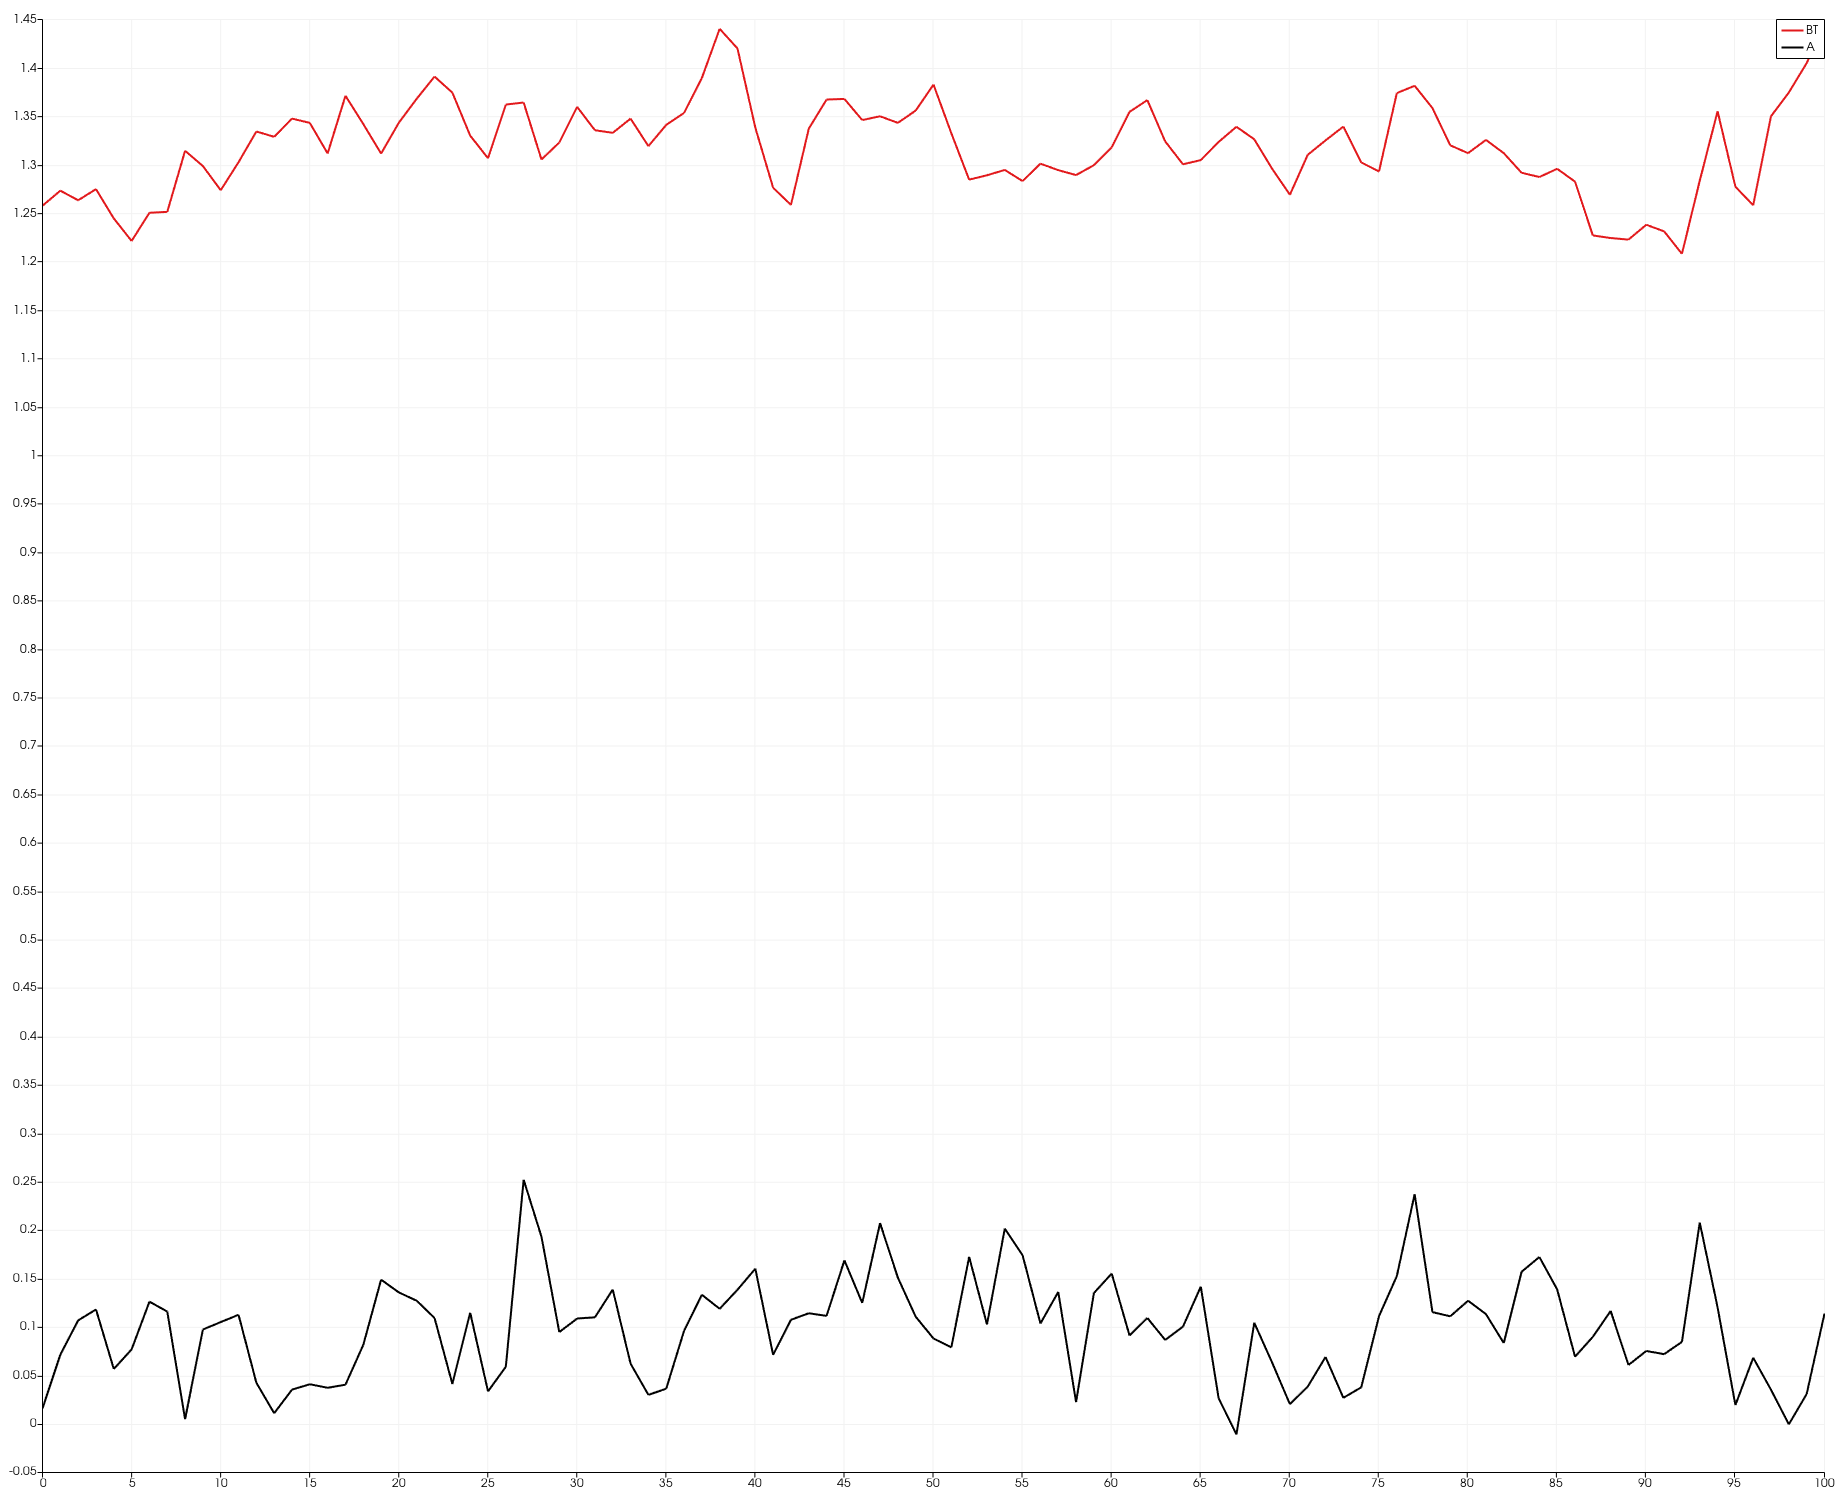
Like this ?
---
### Author:  [@ABCplotCBA](https://discourse.paraview.org/u/ABCplotCBA)
#### Post date: [May 9, 2024, 7:12am UTC](https://discourse.paraview.org/t/line-borders-for-2-different-plots-how-to-make-them-the-same/14531/5 "2024-05-09T07:12:36Z")
Thanks Mathieu and sorry for being late,
please compare these 2 columns (BT, Ap1t).
Also, if plots saved in a separated figures would be better.
[out3\_BT.csv](https://discourse.paraview.org/uploads/short-url/nU5dqmYak0gBDwJdJa46HgV7QQ6.csv) (703 Bytes)
[out4\_Ap1t.csv](https://discourse.paraview.org/uploads/short-url/Jl4UpQ029u6iZwSvlq5WCoNWK6.csv) (1.1 KB)
Later I can merge the figures.
---
### Author:  [@mwestphal](https://discourse.paraview.org/u/mwestphal)
#### Post date: [May 14, 2024, 7:44am UTC](https://discourse.paraview.org/t/line-borders-for-2-different-plots-how-to-make-them-the-same/14531/6 "2024-05-14T07:44:06Z")
> [@ABCplotCBA](#):
>
> Also, if plots saved in a separated figures would be better.
Then you have to configure your axis manually to make sure they are similar.
---
### Author:  [@ABCplotCBA](https://discourse.paraview.org/u/ABCplotCBA)
#### Post date: [May 14, 2024, 8:43am UTC](https://discourse.paraview.org/t/line-borders-for-2-different-plots-how-to-make-them-the-same/14531/7 "2024-05-14T08:43:51Z")
Thanks Mathieu, In case is there any tools to fix the x axis length in the linear plots.