# Line Integral Convolusion
**URL:** https://discourse.paraview.org/t/line-integral-convolusion/11603
**Category:** ParaView Support
**Created:** [March 10, 2023, 12:15am UTC](https://discourse.paraview.org/t/line-integral-convolusion/11603 "2023-03-10T00:15:36Z")
**Posts on this page:** 5
**Page:** 1
### Author:  [@iiskxndar](https://discourse.paraview.org/u/iiskxndar)
#### Post date: [March 10, 2023, 12:15am UTC](https://discourse.paraview.org/t/line-integral-convolusion/11603/1 "2023-03-10T00:15:36Z")
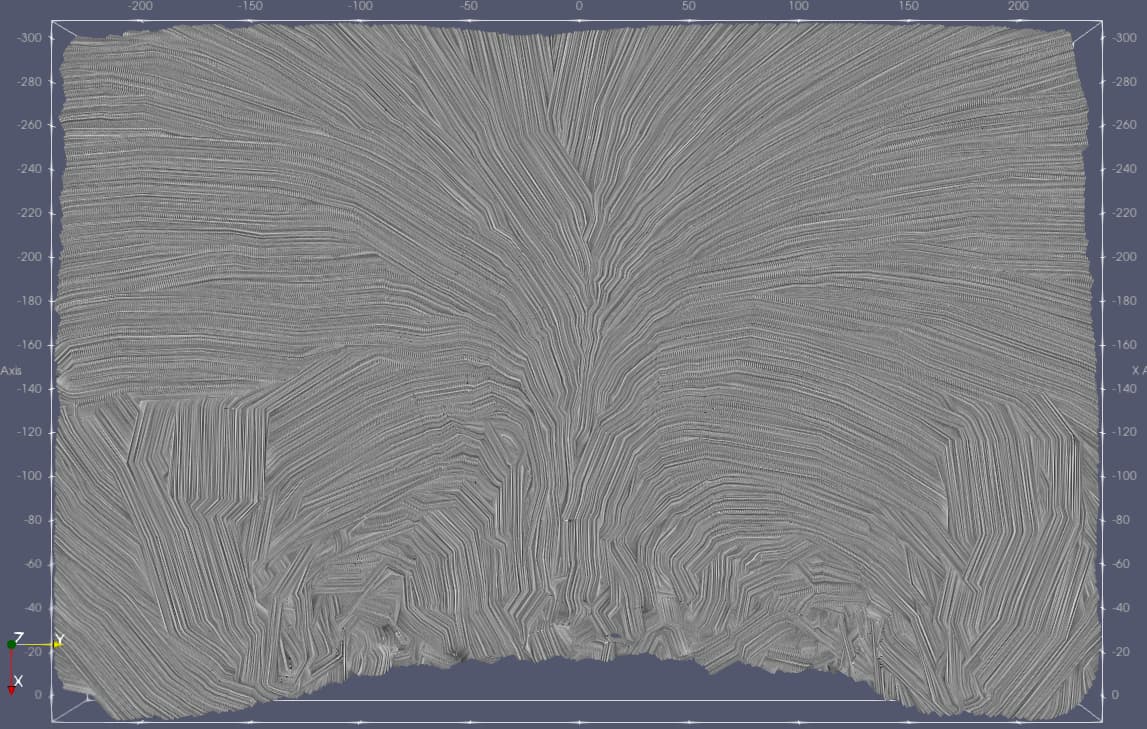
Hi, I am new here. I am interested to learn how to plot a 2D line integral convolusion given x, y, z coordinate and its respective u, v, w velocities. I am doing this with the purpose to find the location of vorticity. In paraviews website [https://www.paraview.org/Wiki/ParaView/Line\_Integral\_Convolution](https://www.paraview.org/Wiki/ParaView/Line_Integral_Convolution), these vortices are very well defined however mine is looking very patchy and not smooth at all. Can someone advise how to improve my plot? Also, even after loading Surface LIC Filter, I do not have Noise texture generator as shown in the paraview website above. How do I get this? Thank you.
---
### Author:  [@utkarsh.ayachit](https://discourse.paraview.org/u/utkarsh.ayachit)
#### Post date: [March 11, 2023, 2:07pm UTC](https://discourse.paraview.org/t/line-integral-convolusion/11603/2 "2023-03-11T14:07:15Z")
have you chosen the correct vector field to use for the LIC? There’s a setting on the Properties panel, make sure it’s using the right vector field. If you can share the dataset, perhaps someone could explain what’s going on here.
---
### Author:  [@iiskxndar](https://discourse.paraview.org/u/iiskxndar)
#### Post date: [March 12, 2023, 12:28am UTC](https://discourse.paraview.org/t/line-integral-convolusion/11603/3 "2023-03-12T00:28:41Z")
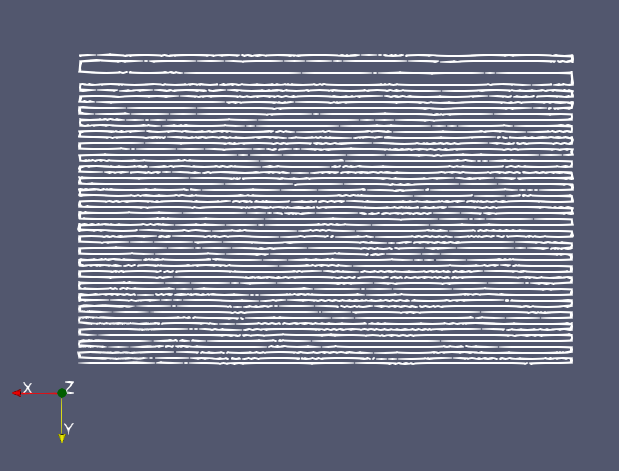
Just a brief background, I am conducting a wheel’s wake study in the wind tunnel. The tool, probecapture, is used to scan the shape of the wake behind the wheel in a zig zag manner as shown below. This tool provides the xyz coordinates and uvw velocity of each location. The wind is blowing towards the wheel in the X axis. Hence, the image captured would be in the YZ plane (Y in the vertical direction). Since I am doing this in 2D, I set my actual Z axis in paraview’s X column.
Steps done to achieve the LIC plot above :
1. Upload Excel sheet and apply Table to point Filter
2. Apply calculator filter to calculate Vector field. This Result is named ‘Velocity’. Am I using the correct formula?
3. Create Glyph filter and apply Surface LIC representation.
Whereas,
Orientation Array: Velocity
Scale Array: u
Glyph Mode: Every Nth point
Surface LIC Integrator, Vectors: ‘Velocity’
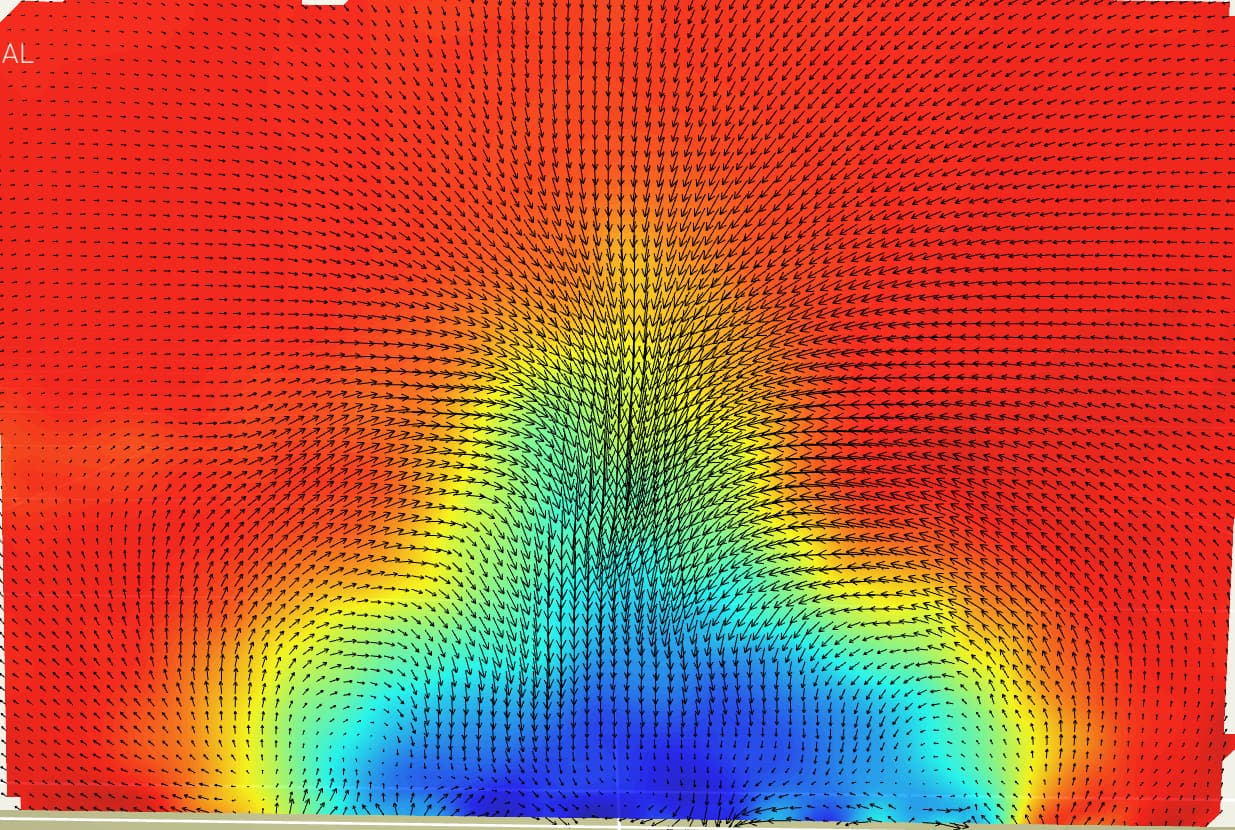
The probecapture’s version of the wheel wake is shown below. We can clearly see that there are 2 vortices forming at the side of the wake. Perhaps the resolution was not high enough to create a clear LIC?
I am unable to post the data here as the file is too large. But this is a sneak peak of the data probcapture provided me:
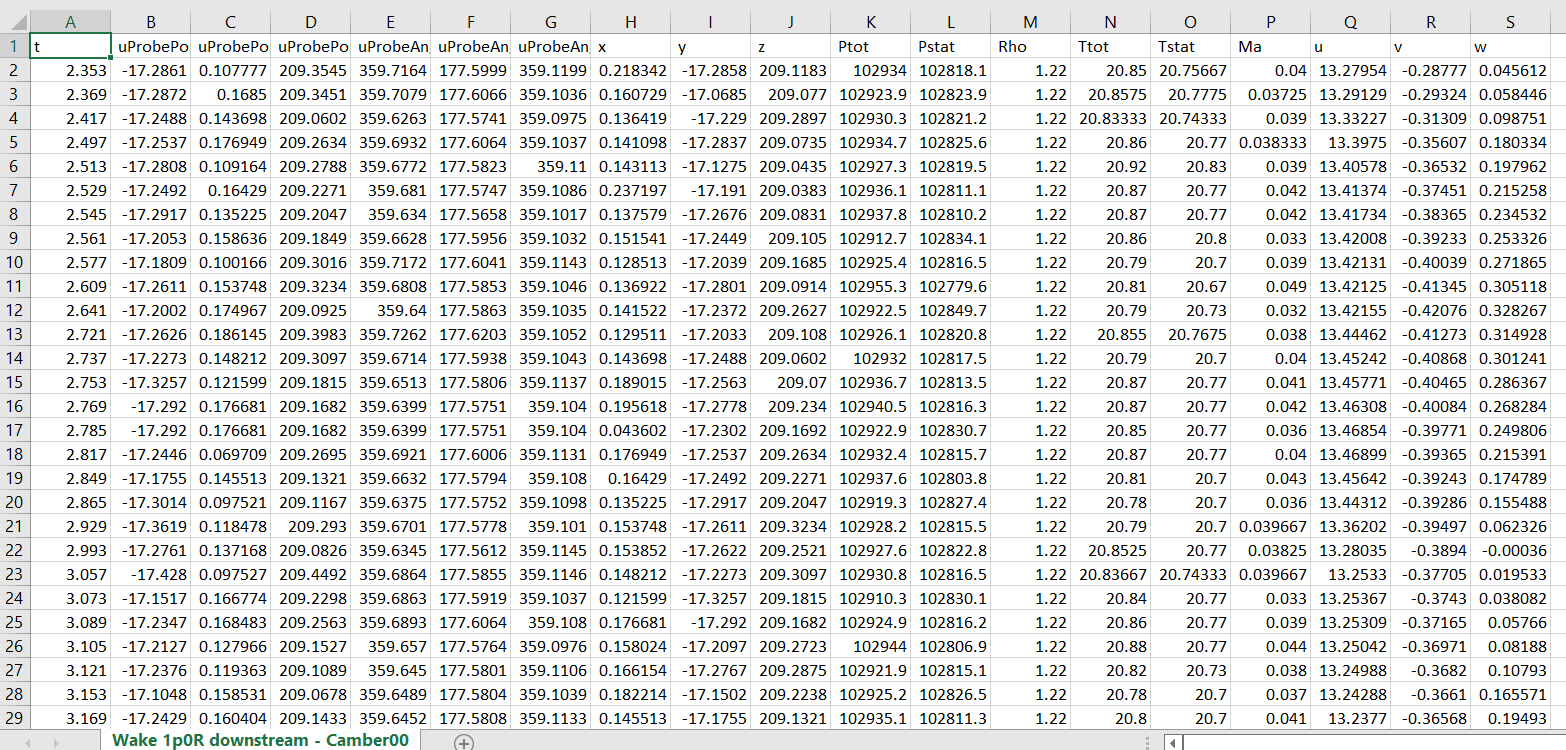
Any help would be greatly appreciated!
---
### Author:  [@utkarsh.ayachit](https://discourse.paraview.org/u/utkarsh.ayachit)
#### Post date: [March 12, 2023, 3:31am UTC](https://discourse.paraview.org/t/line-integral-convolusion/11603/4 "2023-03-12T03:31:35Z")
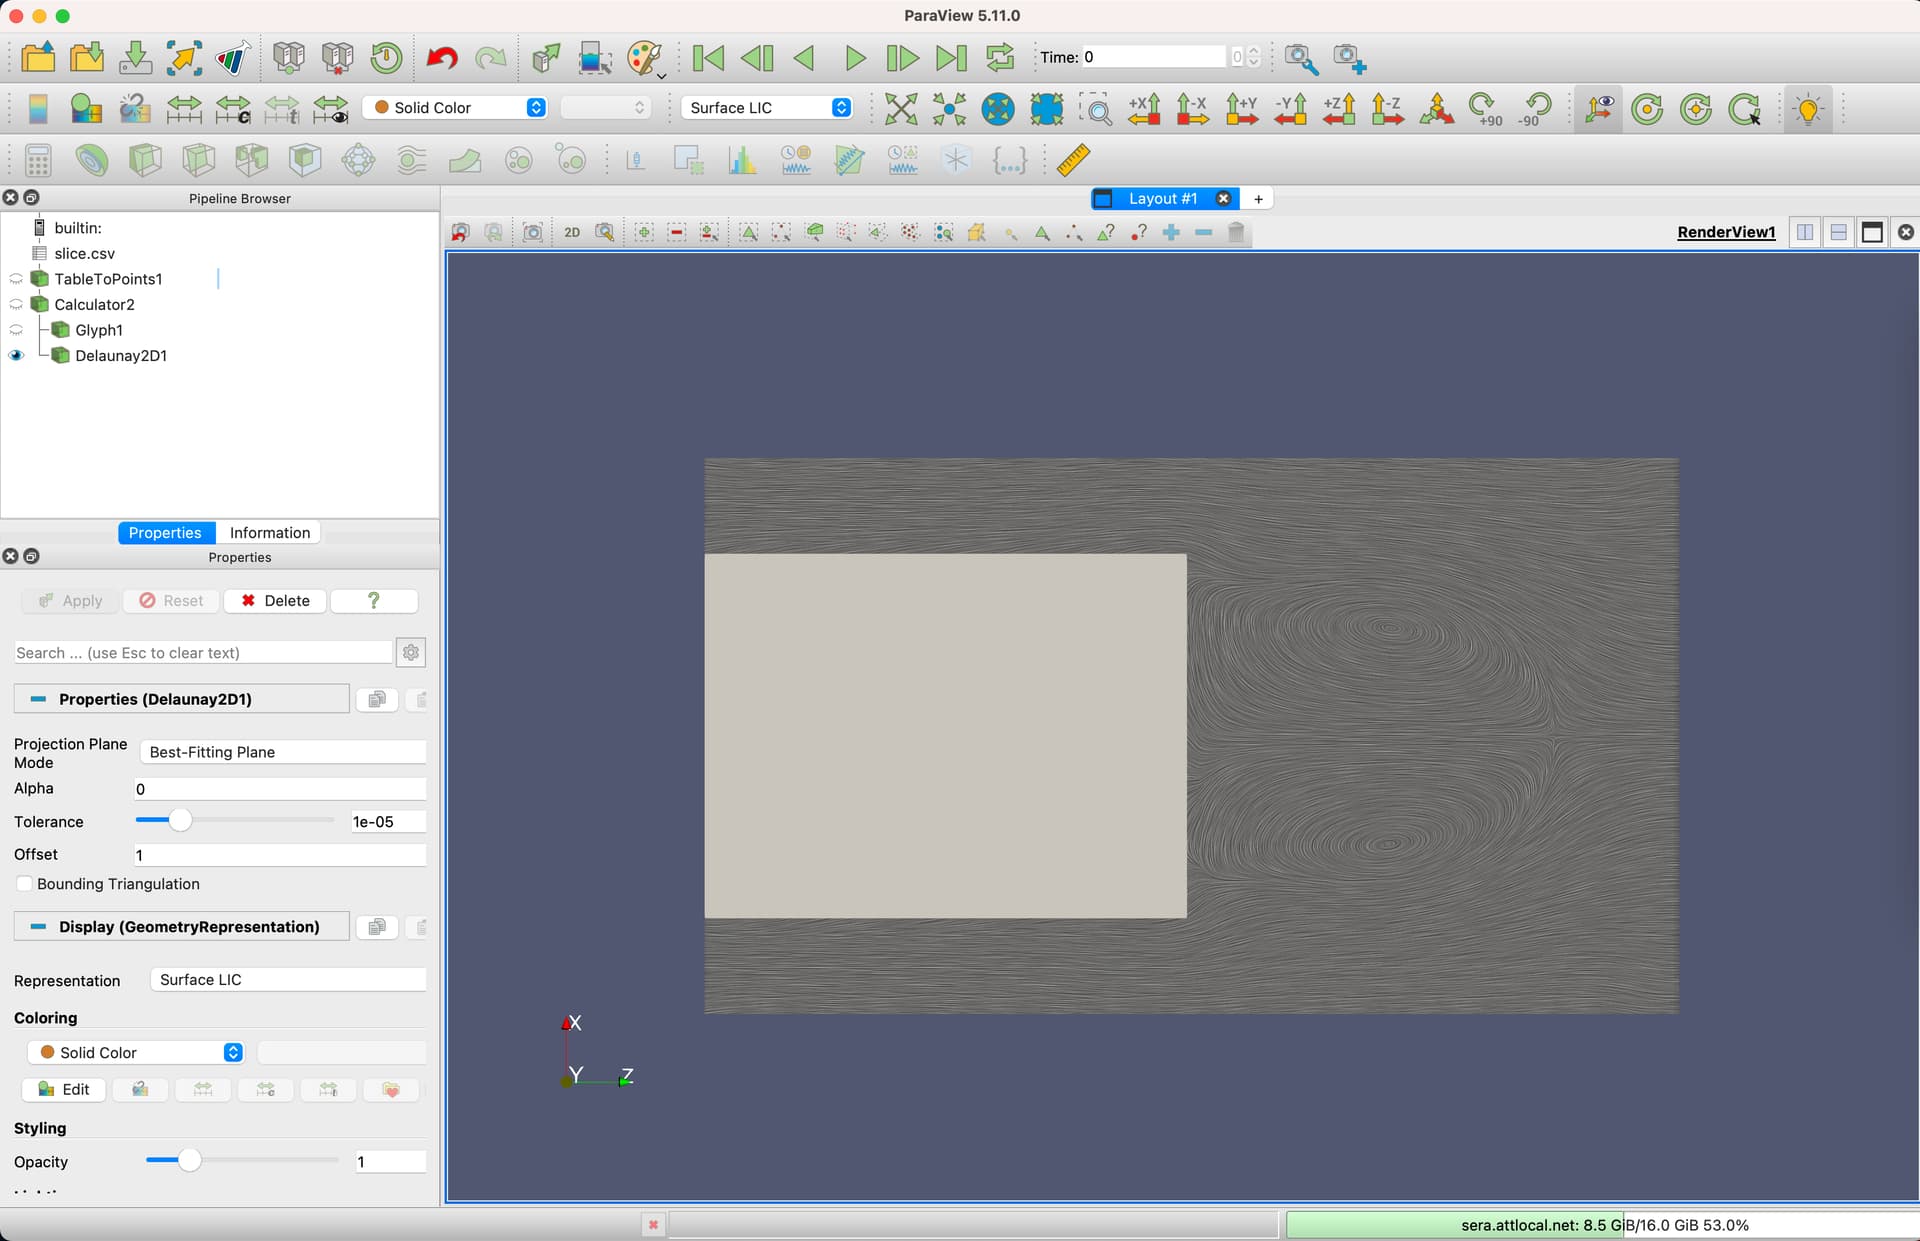
The pipeline you’re using is not correct. If you can upload the dataset somewhere (e.g. google drive) and then share that, that’d make it easier. Also try compressing the dataset: a CSV file will compress very well.
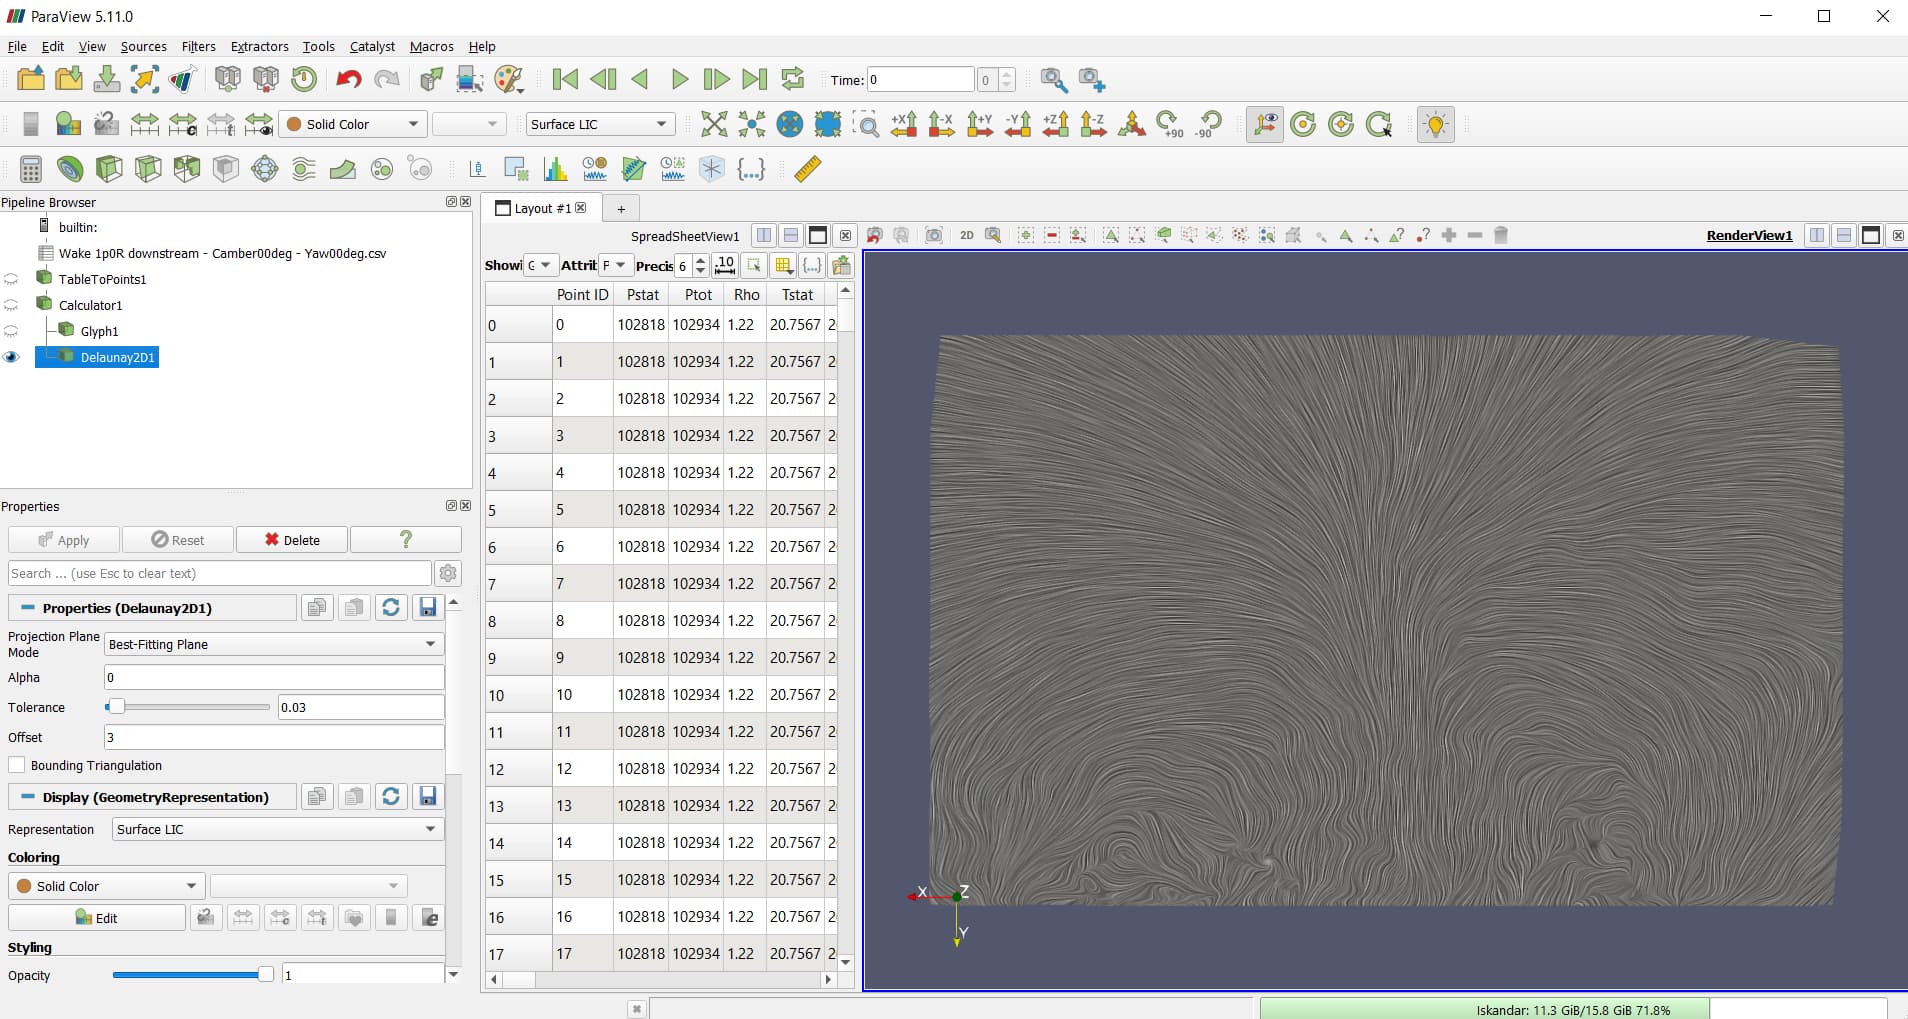
You shouldn’t be using SurfaceLIC on the Glyph filter, but on a surface mesh generated after apply a filter like Delaunay2D after the Calculator. Also, I don’t understand how using M for z coordinate can work. It’ll be be easier if you share the dataset…since then I can better understand what the CSV really represents.
Here’s my sample pipeline with a dummy CSV I created from an example dataset.
---
### Author:  [@iiskxndar](https://discourse.paraview.org/u/iiskxndar)
#### Post date: [March 13, 2023, 12:18am UTC](https://discourse.paraview.org/t/line-integral-convolusion/11603/5 "2023-03-13T00:18:26Z")
> [@utkarsh.ayachit](#):
>
> ouldn’t be using SurfaceLIC on the Glyph filter, but on a s
Thank you for assisting me on this matter.
I thought the Ma in the Z coordinate would not matter since I ticked the 2D box. Hence only the x and y column is considered no? I have shared the file at [Paraview - Google Drive](https://drive.google.com/drive/u/0/folders/1-4uie5SxGW4xc5m2K-lVLy1bxAlp17QV) .
Trying the Delaunay2S Filter does give me a better result but I am still unable to see the location of the vorticity as the spirals are all over the place.