# Line Plot Interpolator does not plot data for different mesh type
**URL:** https://discourse.paraview.org/t/line-plot-interpolator-does-not-plot-data-for-different-mesh-type/5351
**Category:** ParaView Support
**Created:** [September 15, 2020, 4:40pm UTC](https://discourse.paraview.org/t/line-plot-interpolator-does-not-plot-data-for-different-mesh-type/5351 "2020-09-15T16:40:32Z")
**Posts on this page:** 3
**Page:** 1
### Author:  [@IshaanDesai](https://discourse.paraview.org/u/IshaanDesai)
#### Post date: [September 15, 2020, 4:40pm UTC](https://discourse.paraview.org/t/line-plot-interpolator-does-not-plot-data-for-different-mesh-type/5351/1 "2020-09-15T16:40:32Z")
Hi,
I have added 2D data from CSV files into ParaView and used the TableToPoints filter for visualization. I want to do a plot over a line in this domain but as I have opened CSV data with the format (x, y, data\_value) I cannot do PlotoverLine directly. Hence I am using PlotLineInterpolator. I see the following output:
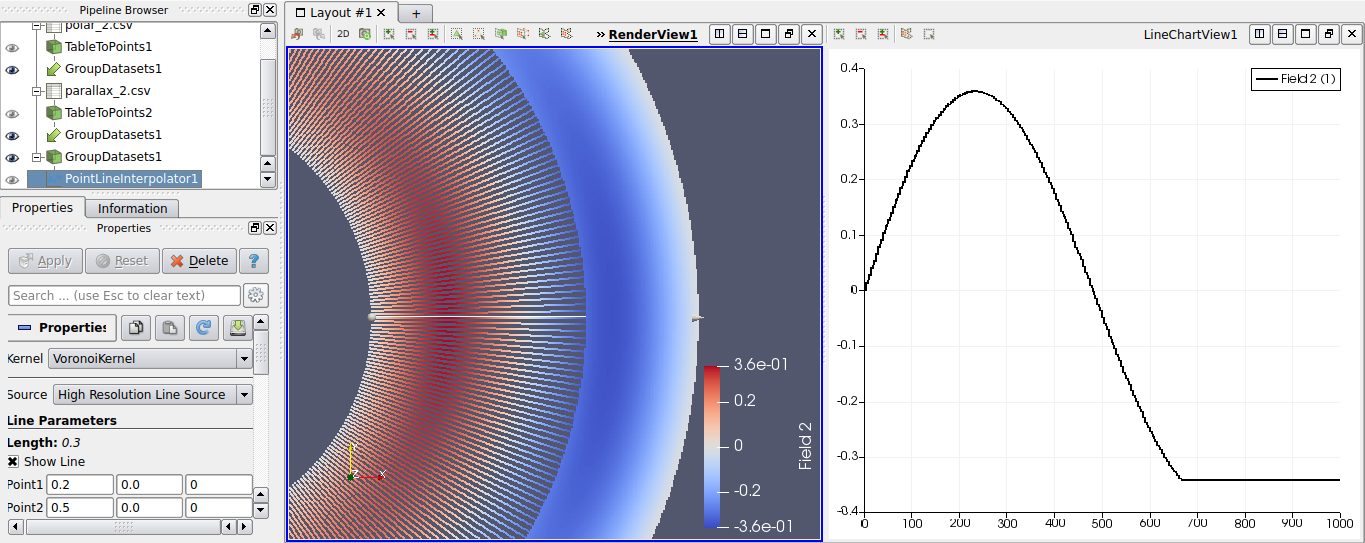
Beyond a certain point I see a flat line in the plot but I can see that there are physical values in the fields. My data is such that the part which is plotted correctly is are curvilinear mesh coordinates and the part which is not plotted are uniform cartesian mesh coordinates.
I have attached the data to reproduce this issue. Am I doing something wrong here? How can I get the correct plot?
CSV data:
[parallax\_0.csv](https://discourse.paraview.org/uploads/short-url/obPH1kPzmlKykKggu3bMJp1kw4D.csv) (650.1 KB) [polar\_0.csv](https://discourse.paraview.org/uploads/short-url/5Nos1Rik530NApldE9To8GHAQS3.csv) (197.3 KB)
---
### Author:  [@Kenichiro-Yoshimi](https://discourse.paraview.org/u/Kenichiro-Yoshimi)
#### Post date: [September 17, 2020, 3:09am UTC](https://discourse.paraview.org/t/line-plot-interpolator-does-not-plot-data-for-different-mesh-type/5351/2 "2020-09-17T03:09:18Z")
Hello,
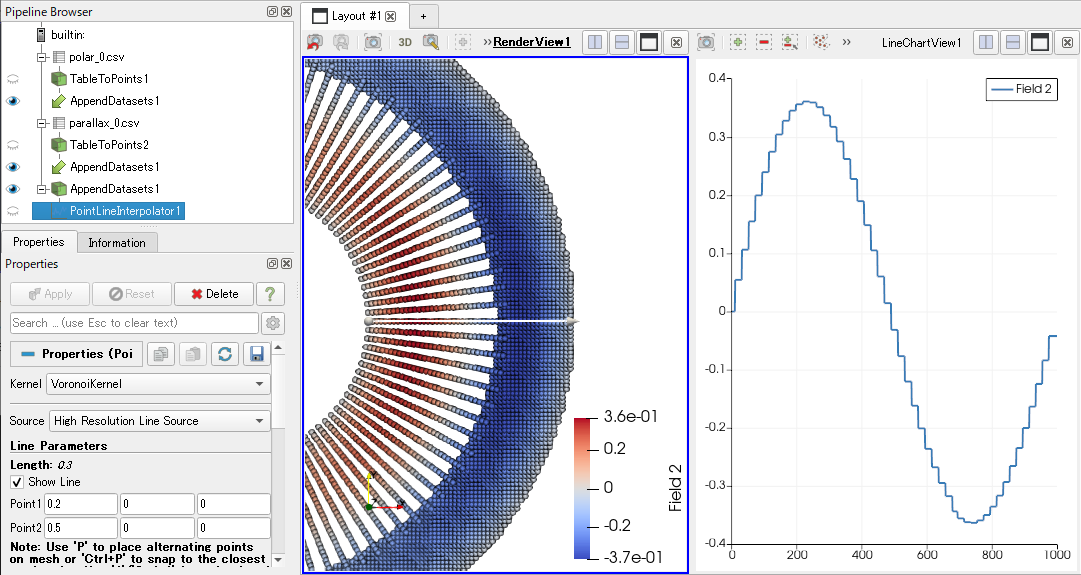
Would you try to use the **Append Datasets** filter instead of the **Group Datasets**?
---
### Author:  [@IshaanDesai](https://discourse.paraview.org/u/IshaanDesai)
#### Post date: [October 8, 2020, 6:53am UTC](https://discourse.paraview.org/t/line-plot-interpolator-does-not-plot-data-for-different-mesh-type/5351/3 "2020-10-08T06:53:21Z")
Hi @Kenichiro-Yoshimi this works! Thank you so much!
I apologise for the late reply too, was busy with other stuff 🙂
I really need this feature and it is good to know that it works now!