# Magnitude not saved when saving .csv, using PlotOverLine filter
**URL:** https://discourse.paraview.org/t/magnitude-not-saved-when-saving-csv-using-plotoverline-filter/6892
**Category:** ParaView Support
**Created:** [April 8, 2021, 11:05am UTC](https://discourse.paraview.org/t/magnitude-not-saved-when-saving-csv-using-plotoverline-filter/6892 "2021-04-08T11:05:43Z")
**Posts on this page:** 3
**Page:** 1
### Author:  [@kamilova-maths](https://discourse.paraview.org/u/kamilova-maths)
#### Post date: [April 8, 2021, 11:05am UTC](https://discourse.paraview.org/t/magnitude-not-saved-when-saving-csv-using-plotoverline-filter/6892/1 "2021-04-08T11:05:43Z")
Hi everyone,
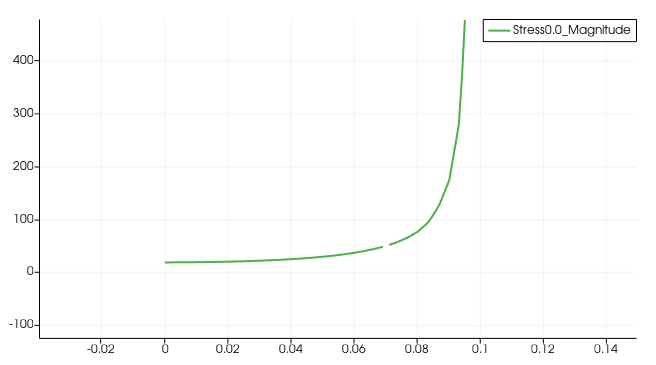
I am using ParaView from the GUI, and I am using the PlotOverLine filter to evaluate my normal stress results on specific boundaries. Specifically, what PlotOverLine shows is Stress0.0\_Magnitude.
I then select the filter and export the csv file. The resulting .csv file does not show Stress0.0\_Magnitude, but it shows absolutely everything else. Furthermore, I don’t know what the magnitude is because I don’t even understand what the other values are (e.g. Stress0.0\_0 up to Stress0.0\_8). Is there any way I can just export the data points of what is actually plotted in ParaView using PlotOverLine? I am so confused. The source file should have the normal stress evaluated everywhere, so plotting this value over a specific line should just give the normal stress over that boundary.
This is what ParaView plots for me (and what I want to export):
And this is a screenshot of what I get from exporting the .csv file:

No Stress0.0\_Magnitude ☹
Any help would be greatly appreciated!
---
### Author:  [@nicolas.vuaille](https://discourse.paraview.org/u/nicolas.vuaille)
#### Post date: [April 8, 2021, 12:57pm UTC](https://discourse.paraview.org/t/magnitude-not-saved-when-saving-csv-using-plotoverline-filter/6892/2 "2021-04-08T12:57:16Z")
Magnitude is often recomputed on the fly by ParaView, but may not be part of the actual data. You need to add the array with the Calculator filter, with `mag(Stress0.0)`
---
### Author:  [@kamilova-maths](https://discourse.paraview.org/u/kamilova-maths)
#### Post date: [April 8, 2021, 1:01pm UTC](https://discourse.paraview.org/t/magnitude-not-saved-when-saving-csv-using-plotoverline-filter/6892/3 "2021-04-08T13:01:46Z")
Thank you! 😃