# Mapping data
**URL:** https://discourse.paraview.org/t/mapping-data/2965
**Category:** ParaView Support
**Tags:** vtk, python
**Created:** [November 12, 2019, 6:57pm UTC](https://discourse.paraview.org/t/mapping-data/2965 "2019-11-12T18:57:15Z")
**Posts on this page:** 10
**Page:** 1
### Author:  [@Samanvith\_A](https://discourse.paraview.org/u/Samanvith_A)
#### Post date: [November 12, 2019, 6:57pm UTC](https://discourse.paraview.org/t/mapping-data/2965/1 "2019-11-12T18:57:15Z")
Myself Samanvith,
I am doing my post-grad in IIT Indore.
I have 3d gridded data ( 384, 384, 384) and I have a coordinate data, X, Y, Z each of length 122987. I want to map the coordinate data to the gridded data. It would be helpful if I get a solution to it.
---
### Author:  [@mwestphal](https://discourse.paraview.org/u/mwestphal)
#### Post date: [November 13, 2019, 6:57am UTC](https://discourse.paraview.org/t/mapping-data/2965/2 "2019-11-13T06:57:20Z")
use the RessampleToImage filter.
---
### Author:  [@Samanvith\_A](https://discourse.paraview.org/u/Samanvith_A)
#### Post date: [November 13, 2019, 8:59am UTC](https://discourse.paraview.org/t/mapping-data/2965/3 "2019-11-13T08:59:35Z")
Hey Mathieu,
For which data set I should use RessampleToImage filter.
I tried using it on the gridded data, but there isn’t any satisfactory results
The coordinate data is a array data, X, Y, Z. Then I stored into a single array with each column as X,Y,Z. Then I have stored in a .csv file.
The gridded data, is in .VTK file format
---
### Author:  [@mwestphal](https://discourse.paraview.org/u/mwestphal)
#### Post date: [November 13, 2019, 9:07pm UTC](https://discourse.paraview.org/t/mapping-data/2965/4 "2019-11-13T21:07:59Z")
Sorry, not sure to follow what you are trying to achieve, please explain in more details.
---
### Author:  [@Samanvith\_A](https://discourse.paraview.org/u/Samanvith_A)
#### Post date: [November 14, 2019, 11:07am UTC](https://discourse.paraview.org/t/mapping-data/2965/5 "2019-11-14T11:07:41Z")
@mwestphal
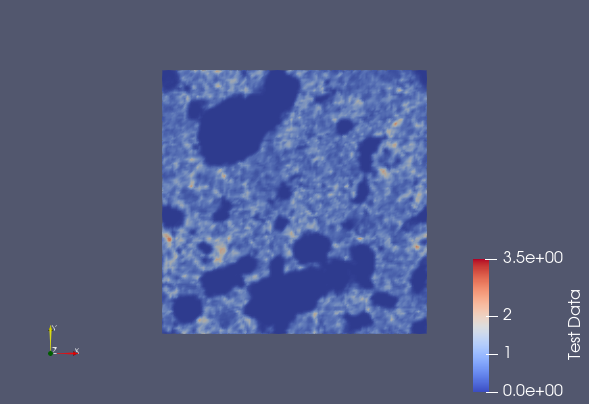
I have extracted data of HI (neutral hydrogen) maps from a binary file, which is I have converted into a 3D gridded data, whose dim is (384, 384 384). I have successfully created a VTK file of this and was able to create a 3D cube of this HI map. I have attached an image of it.
Now I have a data file of Halos( binary file), from which I have extracted the coordinates of halos( X, Y, Z) and then stored it in a CSV file, which has length 122988 each. I have attached the file of this
Now I want to map the coordinates to the HI map. I am not able to understand how to do it.
I hope the explanation helps you.
[numbers.csv](https://discourse.paraview.org/uploads/short-url/3zRv5X7IxprrhaRUJFcpaPAfPL2.csv) (3.5 MB)
---
### Author:  [@Kenneth\_Moreland](https://discourse.paraview.org/u/Kenneth_Moreland)
#### Post date: [November 14, 2019, 3:18pm UTC](https://discourse.paraview.org/t/mapping-data/2965/6 "2019-11-14T15:18:58Z")
You can read in your csv file directly into ParaView. ParaView will initially show it as a table. You can then use the `Table To Points` filter to convert the table into points located in 3D space. Here is a state file that loads your csv file as described.
[load-numbers.pvsm](https://discourse.paraview.org/uploads/short-url/w3xINGcL6vDLbfzxOEyrGGBZpaP.pvsm) (149.0 KB)
Once you have your points displayed in a 3D space, you can also load in your VTK file of gridded data and show it in the same view at the same time.
---
### Author:  [@Samanvith\_A](https://discourse.paraview.org/u/Samanvith_A)
#### Post date: [November 14, 2019, 6:11pm UTC](https://discourse.paraview.org/t/mapping-data/2965/7 "2019-11-14T18:11:55Z")
Hey @Kenneth_Moreland
I tried the method that you suggested me. But there is a problem in scaling I guess. The VTK data is being displayed too small against the coordinate data rather being displayed together. I have attached both the files for your reference. Please let me know if I am doing anything wrong here.
[numbers.csv](https://discourse.paraview.org/uploads/short-url/3zRv5X7IxprrhaRUJFcpaPAfPL2.csv) (3.5 MB)
[HI map](https://drive.google.com/drive/folders/1yt4heMIjb2owDUODnfSGrz_CESe-6QtE?usp=sharing)
---
### Author:  [@Kenneth\_Moreland](https://discourse.paraview.org/u/Kenneth_Moreland)
#### Post date: [November 15, 2019, 12:21am UTC](https://discourse.paraview.org/t/mapping-data/2965/8 "2019-11-15T00:21:37Z")
Yes, this is a problem with scaling. The bounds of the grid data goes from 0 to 127 in each dimension whereas the bounds of the points go from 0 to 50,000.
I’m pretty sure the problem is with the grid data. A uniform structured grid has an origin (the position of the lower left corner) and a spacing (the size of each cell in the grid). The default spacing of a grid like this is usually 1 (for lack of a better value). That is probably wrong in your case.
There are multiple ways to fix the problem, but the best would be to fix your data file. You can do it for your HI\_8\_128\_grid.vtk file by opening it in a text editor and changing the 6th line from
```auto
SPACING 1 1 1
```
to
```auto
SPACING 393.7 393.7 393.7
```
---
### Author:  [@Samanvith\_A](https://discourse.paraview.org/u/Samanvith_A)
#### Post date: [November 15, 2019, 8:21am UTC](https://discourse.paraview.org/t/mapping-data/2965/9 "2019-11-15T08:21:45Z")
Hey @Kenneth_Moreland
The method worked totally fine. Thanks a lot for your help and time.
I have another query.
What happen when we tick the " keep all data arrays" when applying table to points filter.
---
### Author:  [@mwestphal](https://discourse.paraview.org/u/mwestphal)
#### Post date: [November 18, 2019, 9:50am UTC](https://discourse.paraview.org/t/mapping-data/2965/10 "2019-11-18T09:50:00Z")
Well, all your data arrays associated to points and cells are copied to the output instead of being removed.