# Modify default XYChart parameters
**URL:** https://discourse.paraview.org/t/modify-default-xychart-parameters/9466
**Category:** ParaView Support
**Created:** [April 19, 2022, 5:54pm UTC](https://discourse.paraview.org/t/modify-default-xychart-parameters/9466 "2022-04-19T17:54:34Z")
**Posts on this page:** 5
**Page:** 1
### Author:  [@gu.defromont](https://discourse.paraview.org/u/gu.defromont)
#### Post date: [April 19, 2022, 5:54pm UTC](https://discourse.paraview.org/t/modify-default-xychart-parameters/9466/1 "2022-04-19T17:54:34Z")
Hi,
I would like to specify in a python macro the default parameters (linestyle, linewidth, marker, markersize, color) of a plotdata filter.
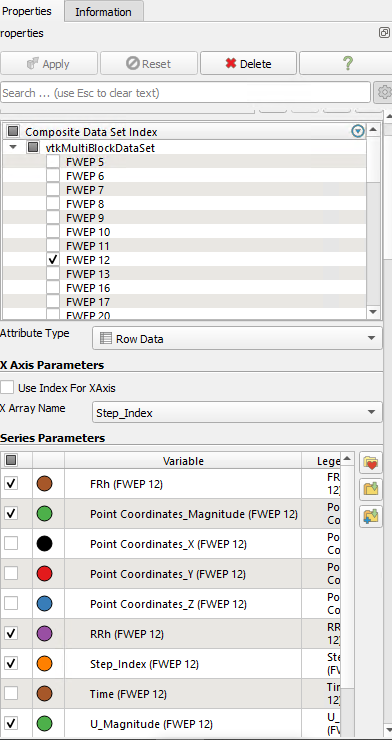
Also I could not find the documentation (all attributes and methods) of the corresponding XYChartRepresentation object created.
Regards,
Guillaume
---
### Author:  [@mwestphal](https://discourse.paraview.org/u/mwestphal)
#### Post date: [April 20, 2022, 7:23am UTC](https://discourse.paraview.org/t/modify-default-xychart-parameters/9466/2 "2022-04-20T07:23:08Z")
Hi @gu.defromont
You can use the python trace to figure it out.
Best,
---
### Author:  [@gu.defromont](https://discourse.paraview.org/u/gu.defromont)
#### Post date: [April 20, 2022, 7:27am UTC](https://discourse.paraview.org/t/modify-default-xychart-parameters/9466/3 "2022-04-20T07:27:50Z")
Hello,
Well I cannot find how to change the defaults of the plot data filter in paraview so… I can only change the style options of some series only. I could do it by displaying all blocks and all the series and then change the style display for all of them (but that would mean around a thousands of series with 5000 times steps). .
---
### Author:  [@mwestphal](https://discourse.paraview.org/u/mwestphal)
#### Post date: [April 20, 2022, 7:31am UTC](https://discourse.paraview.org/t/modify-default-xychart-parameters/9466/4 "2022-04-20T07:31:27Z")
You need to loop on them with python.
---
### Author:  [@gu.defromont](https://discourse.paraview.org/u/gu.defromont)
#### Post date: [April 20, 2022, 7:35am UTC](https://discourse.paraview.org/t/modify-default-xychart-parameters/9466/5 "2022-04-20T07:35:26Z")
Well that’s gonna take some computational time but if I have no choice…
To do that I need to go through all the names of the blocks in the multiblock dataset (because I don’t know these names in advance). Do you know how to do that?
Thanks a lot,
Guillaume