# My Cp Plot: Where have I gone wrong?
**URL:** https://discourse.paraview.org/t/my-cp-plot-where-have-i-gone-wrong/3971
**Category:** ParaView Support
**Created:** [April 5, 2020, 10:03am UTC](https://discourse.paraview.org/t/my-cp-plot-where-have-i-gone-wrong/3971 "2020-04-05T10:03:07Z")
**Posts on this page:** 9
**Page:** 1
### Author:  [@Pippa](https://discourse.paraview.org/u/Pippa)
#### Post date: [April 5, 2020, 10:03am UTC](https://discourse.paraview.org/t/my-cp-plot-where-have-i-gone-wrong/3971/1 "2020-04-05T10:03:07Z")
Hi everyone,
I have been struggling to get a Coefficient of pressure plot vs distance along x for some time.
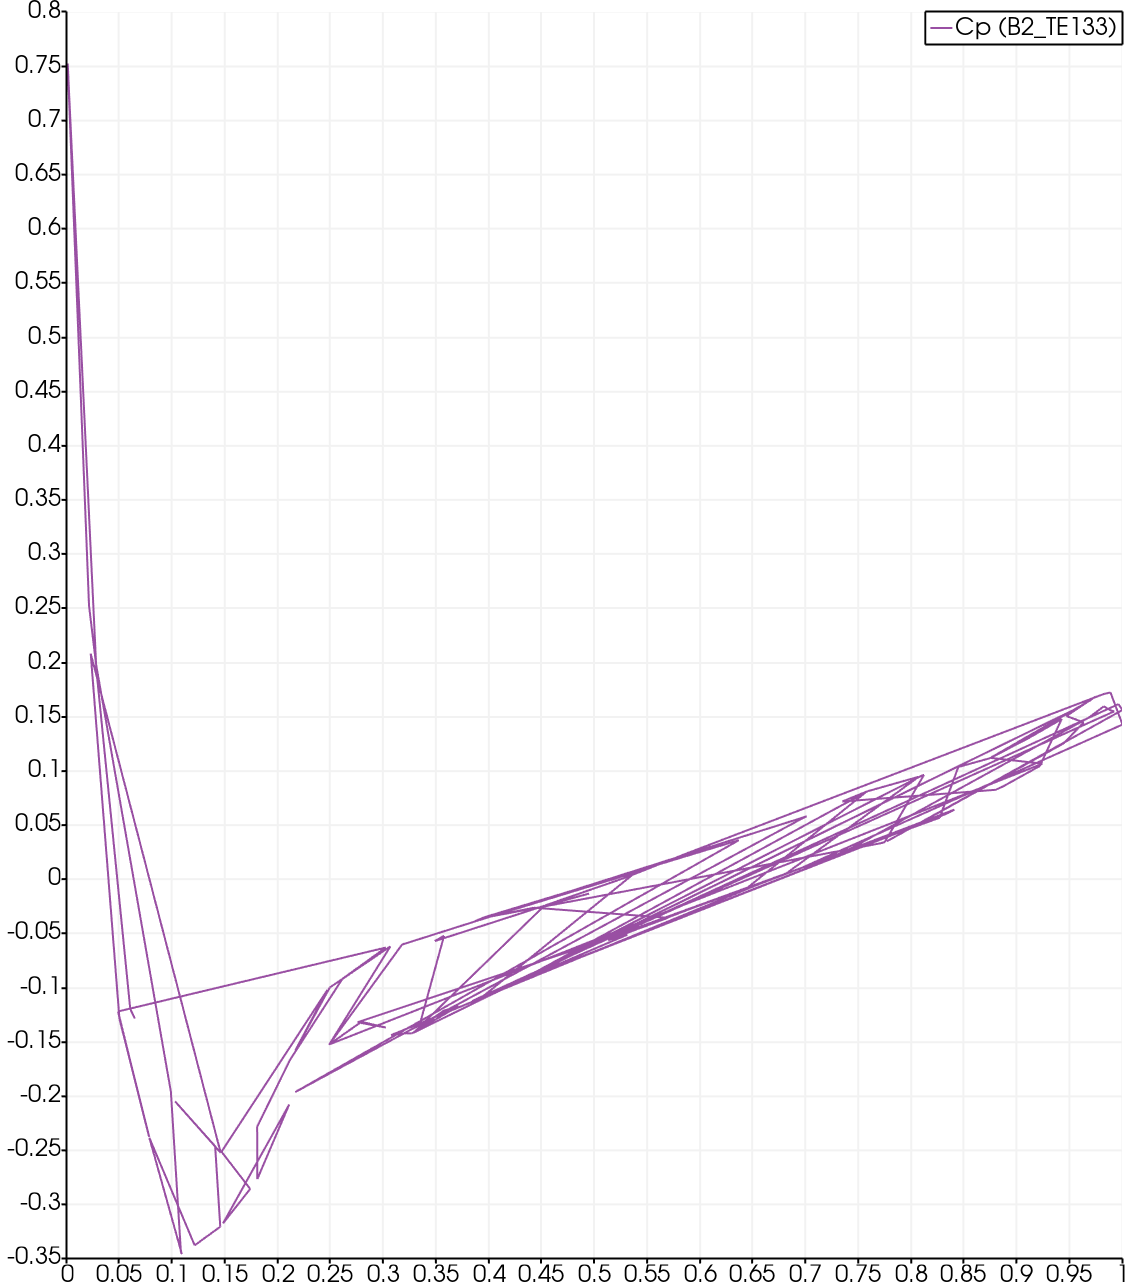
Each time I get this graph which you can see above.
Could anyone suggest where I am going wrong?
I am working in simscale so here is the project if you need to refer. [https://www.simscale.com/workbench/?pid=8358583334176883640&rru=3b68d092-4955-4d43-a17f-ca908f2ae283&ci=a3a6b064-57d1-4166-9a0b-4b04f67f2483&ct=PLOT&mt=SIMULATION\_RESULT](https://www.simscale.com/workbench/?pid=8358583334176883640&rru=3b68d092-4955-4d43-a17f-ca908f2ae283&ci=a3a6b064-57d1-4166-9a0b-4b04f67f2483&ct=PLOT&mt=SIMULATION_RESULT) .
I would appreciate any help or suggestions.
Thank you,
Pippa
---
### Author:  [@mwestphal](https://discourse.paraview.org/u/mwestphal)
#### Post date: [April 6, 2020, 6:32am UTC](https://discourse.paraview.org/t/my-cp-plot-where-have-i-gone-wrong/3971/2 "2020-04-06T06:32:02Z")
Please share an example of your data.
---
### Author:  [@Kenneth\_Moreland](https://discourse.paraview.org/u/Kenneth_Moreland)
#### Post date: [April 6, 2020, 3:17pm UTC](https://discourse.paraview.org/t/my-cp-plot-where-have-i-gone-wrong/3971/3 "2020-04-06T15:17:34Z")
In addition to an example of your data, it is also helpful for information on the steps you are taking in ParaView. Are you using the `Plot Over Line` filter (as is customary to plot a variable for distance) or do you have a data set with a bunch distance/coefficient pairs? From the example graph you gave, it sounds like the distance comes from some source other than `Plot Over Line`. The data are not given in distance order, so ParaView is connecting lines back and forth in the order in which the data are listed.
---
### Author:  [@Pippa](https://discourse.paraview.org/u/Pippa)
#### Post date: [April 6, 2020, 3:26pm UTC](https://discourse.paraview.org/t/my-cp-plot-where-have-i-gone-wrong/3971/4 "2020-04-06T15:26:14Z")
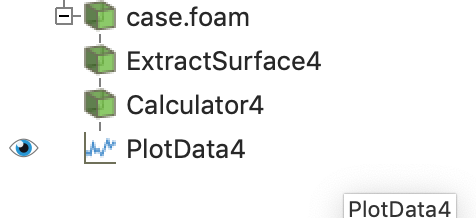
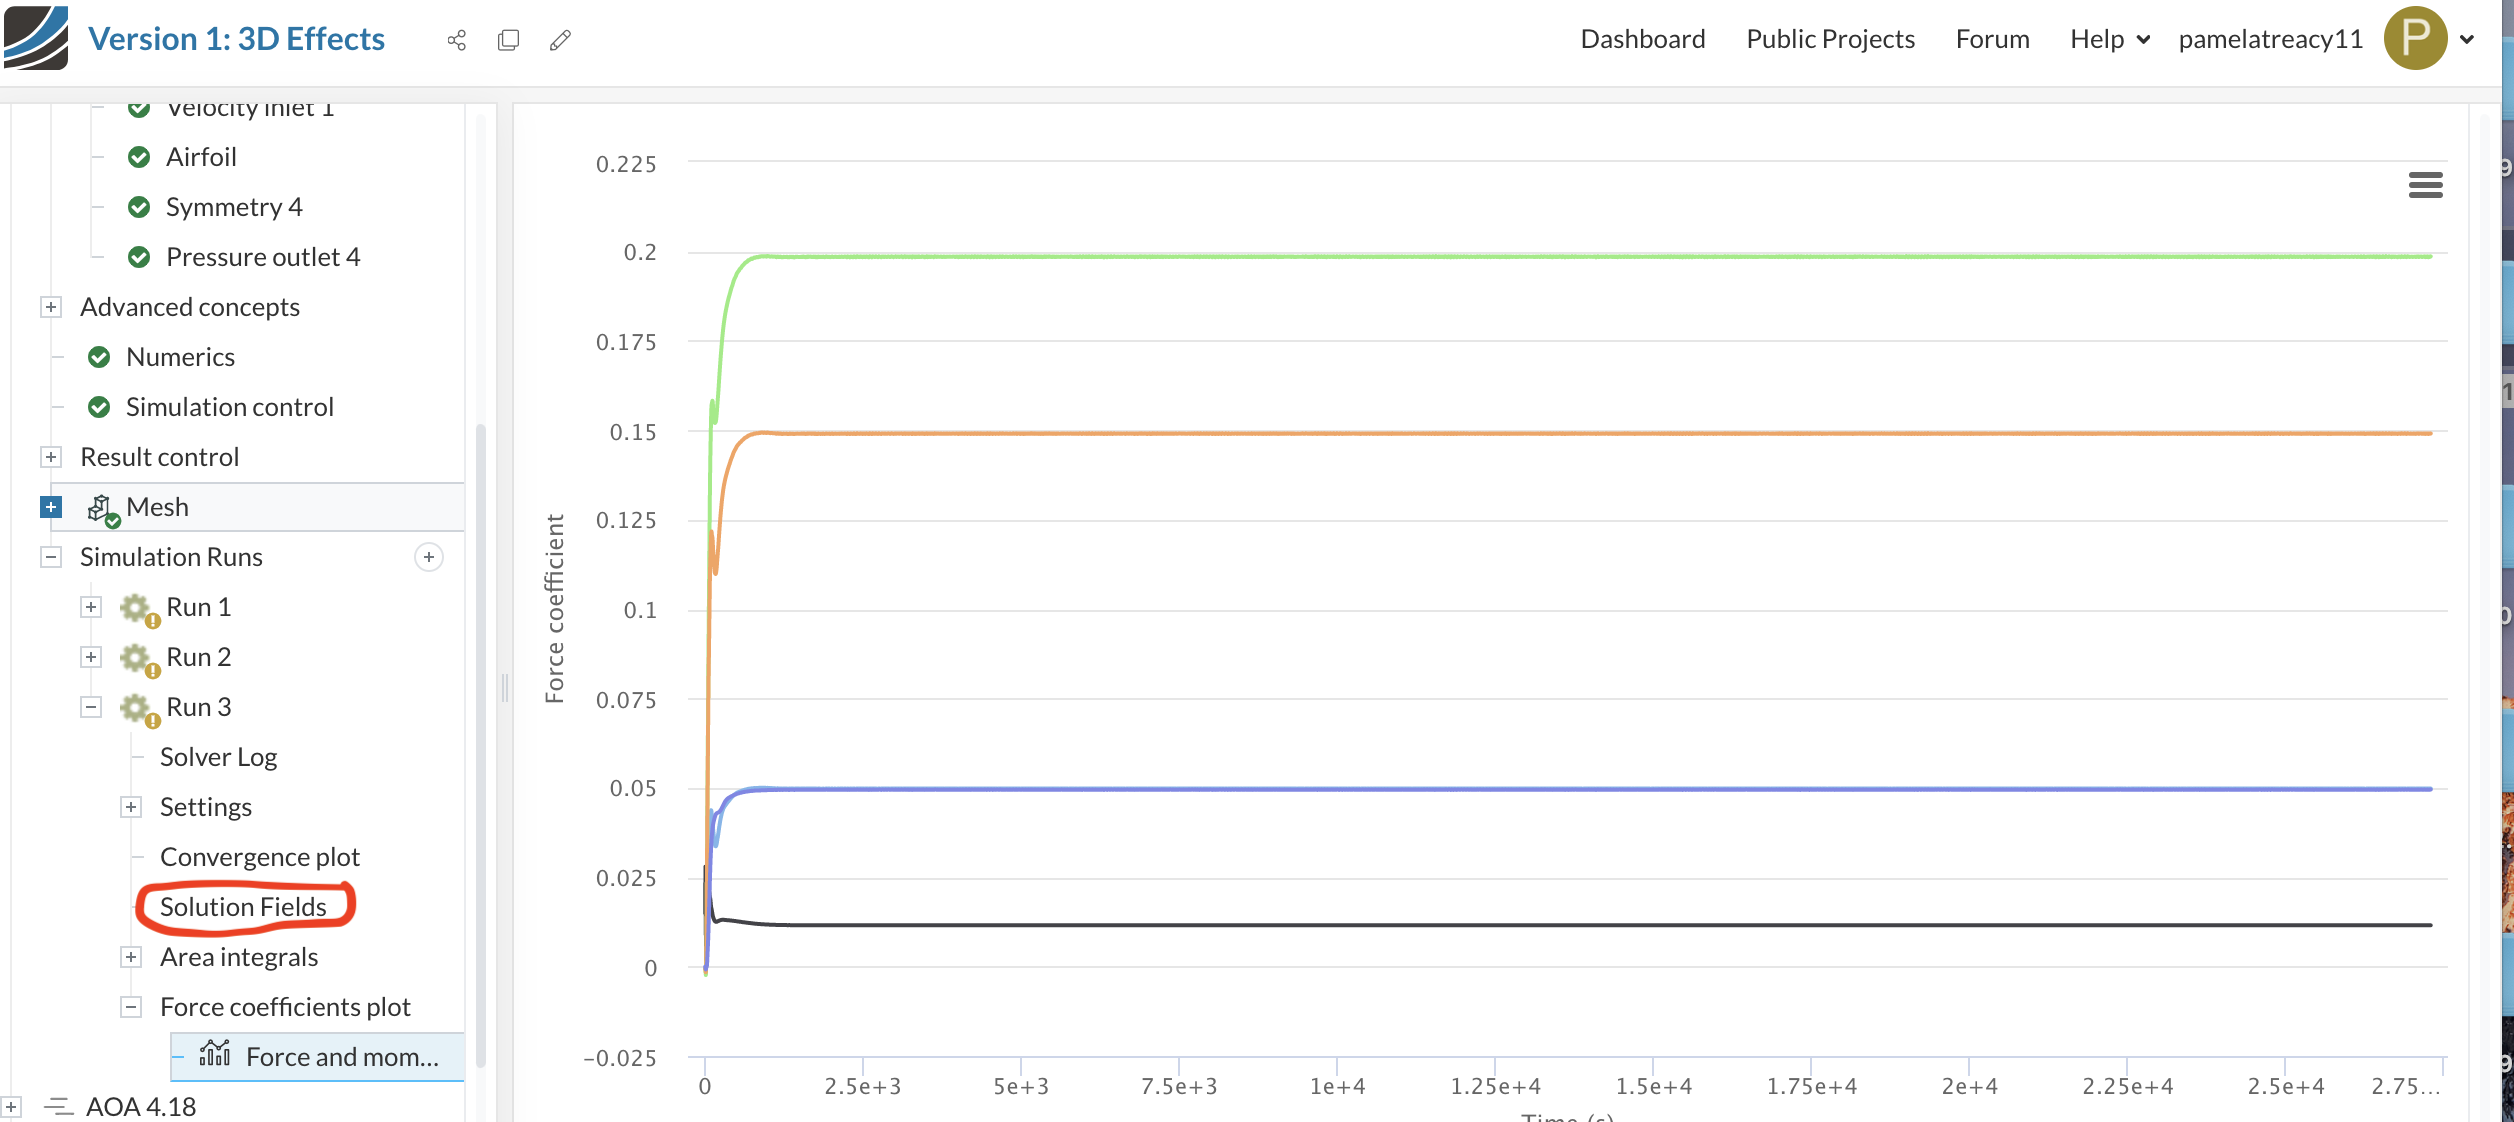
I have tried to attach my data in a zip file but it would not upload for some reason. In the link above I have my simscale data in solution field
. 
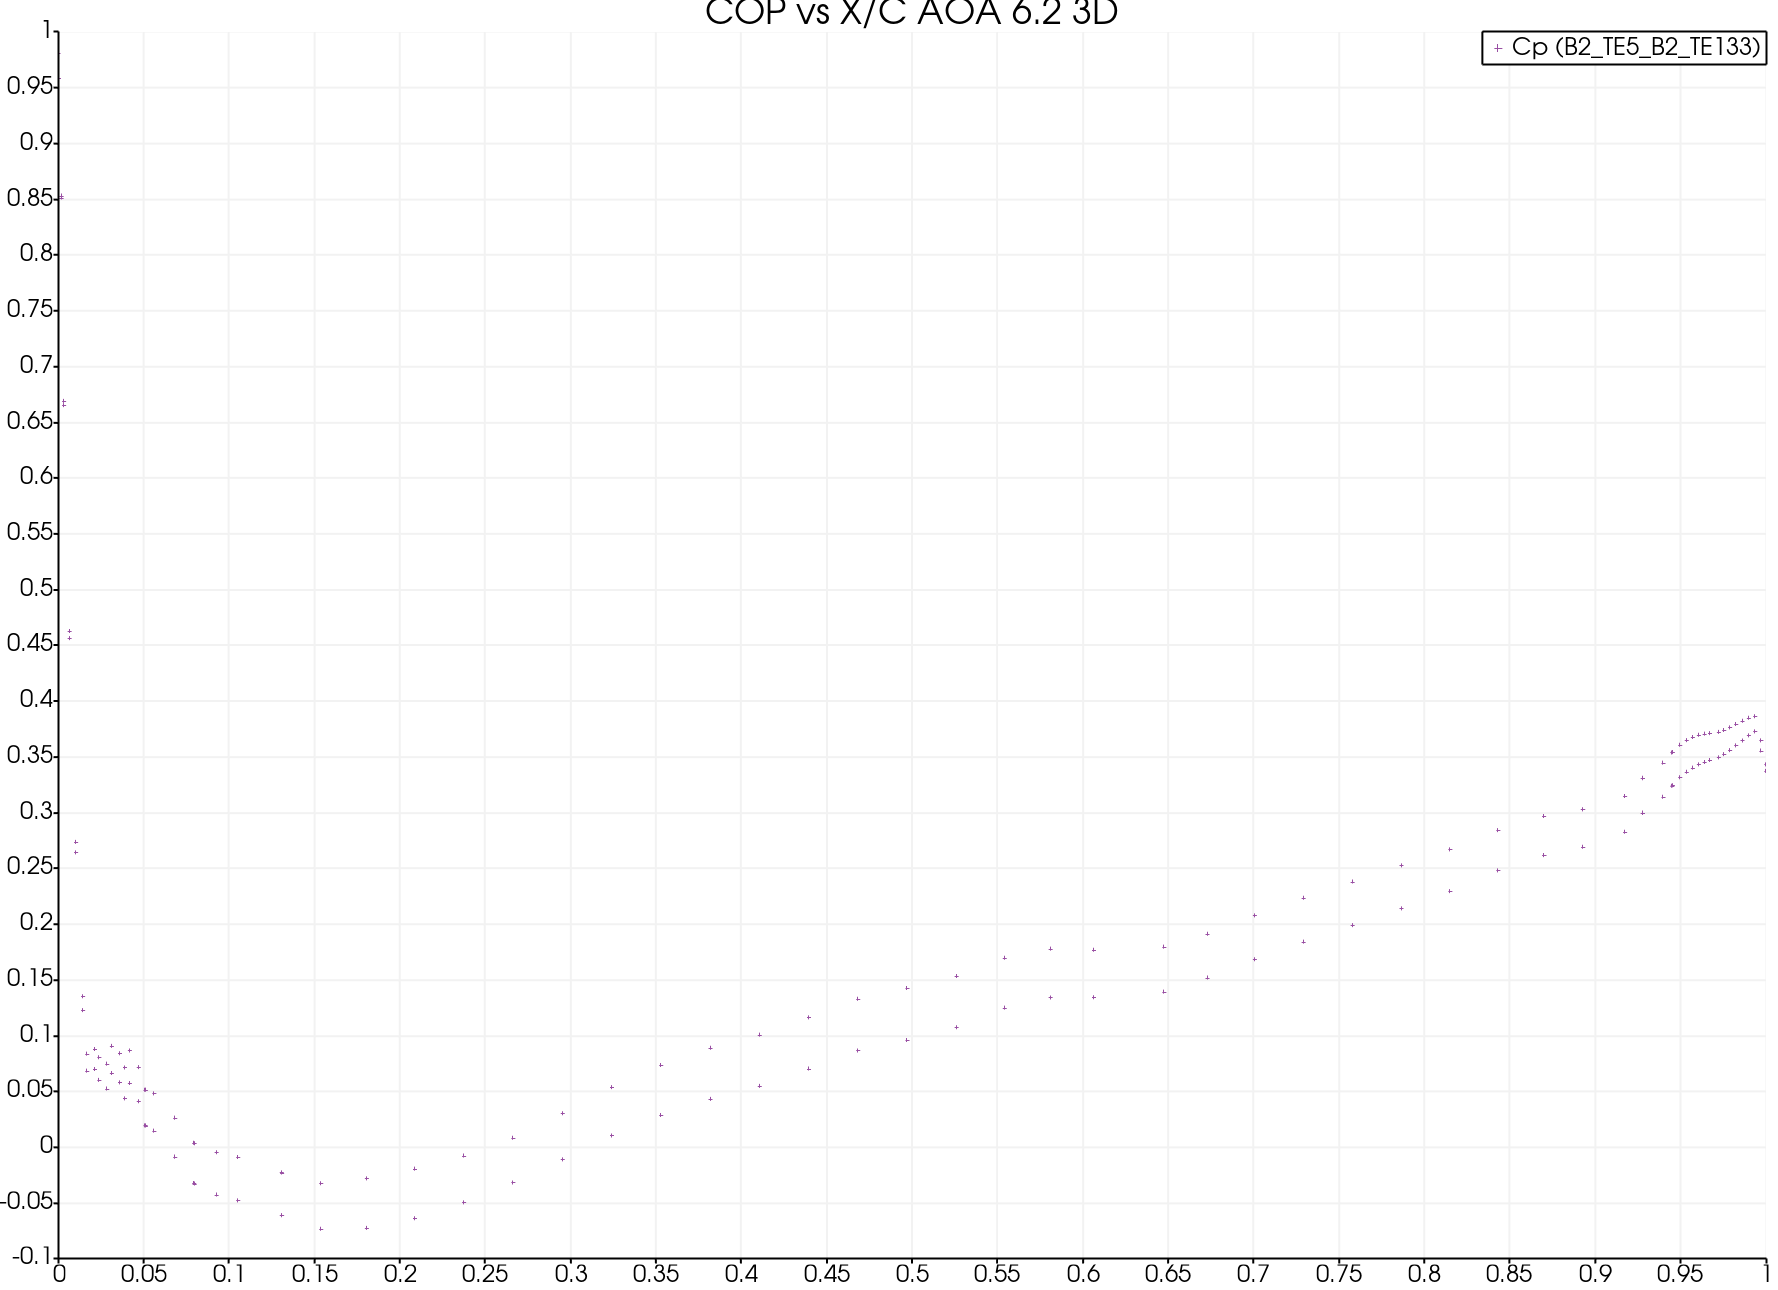
This is an attachment for my 3D wing at AOA of 6.2. This is what I am getting at the moment. I dont have the lines anymore as I plotted as points but the data is looking very off and I’m not sure why. I am using Plot Data and creating the lines first and then creating the points.
Thank you both for the help
---
### Author:  [@mwestphal](https://discourse.paraview.org/u/mwestphal)
#### Post date: [April 7, 2020, 3:39am UTC](https://discourse.paraview.org/t/my-cp-plot-where-have-i-gone-wrong/3971/5 "2020-04-07T03:39:06Z")
Can’t really help you without data. If you can’t share it on discourse, use a service like WeTransfer please.
---
### Author:  [@mwestphal](https://discourse.paraview.org/u/mwestphal)
#### Post date: [April 7, 2020, 10:22am UTC](https://discourse.paraview.org/t/my-cp-plot-where-have-i-gone-wrong/3971/6 "2020-04-07T10:22:42Z")
please share also a statefile.
File -\> Save State.
---
### Author:  [@Pippa](https://discourse.paraview.org/u/Pippa)
#### Post date: [April 7, 2020, 11:10am UTC](https://discourse.paraview.org/t/my-cp-plot-where-have-i-gone-wrong/3971/7 "2020-04-07T11:10:37Z")
Those are the two files…
> **[file.zip](https://wetransfer.com/downloads/6feb17f08cb27800c47851bf21800bb520200407105630/129a5e)**
>
> 1 file sent via WeTransfer, the simplest way to send your files around the world
> **[2ND.pvsm](https://wetransfer.com/downloads/77576a4e0ff73a140354fdee1e12311320200407105509/281e3b)**
>
> 1 file sent via WeTransfer, the simplest way to send your files around the world
---
### Author:  [@Pippa](https://discourse.paraview.org/u/Pippa)
#### Post date: [April 7, 2020, 4:22pm UTC](https://discourse.paraview.org/t/my-cp-plot-where-have-i-gone-wrong/3971/8 "2020-04-07T16:22:50Z")
This occurs with any 3D data that I produce even if the experimental results are equating to the coefficient of lift and drag I get in the solver log. I can plot 2D results fine in ParaView.
---
### Author:  [@mwestphal](https://discourse.paraview.org/u/mwestphal)
#### Post date: [April 8, 2020, 1:42am UTC](https://discourse.paraview.org/t/my-cp-plot-where-have-i-gone-wrong/3971/9 "2020-04-08T01:42:05Z")
Line in a chart view are plotted in the order of the data. This order does not mean anything as it come from the indexing of the points.
As @Kenneth_Moreland stated, You want to use something like PlotOverLine instead of Plot Data.
Reread his message, all you need is there.