# New to Paraview and I need help with understanding the data.
**URL:** https://discourse.paraview.org/t/new-to-paraview-and-i-need-help-with-understanding-the-data/8788
**Category:** ParaView Support
**Created:** [January 17, 2022, 11:05am UTC](https://discourse.paraview.org/t/new-to-paraview-and-i-need-help-with-understanding-the-data/8788 "2022-01-17T11:05:57Z")
**Posts on this page:** 9
**Page:** 1
### Author:  [@seb](https://discourse.paraview.org/u/seb)
#### Post date: [January 17, 2022, 11:05am UTC](https://discourse.paraview.org/t/new-to-paraview-and-i-need-help-with-understanding-the-data/8788/1 "2022-01-17T11:05:57Z")
So just as the title says I want to know what the data means. By this I mean the table that appears when you go to Filters \> Integrate Variables.
Could someone explain to me what these mean and the units.
The “Drag” variable in the photo is the “Calculator” filter and “Normals\_Y” as the scalar value.

---
### Author:  [@mwestphal](https://discourse.paraview.org/u/mwestphal)
#### Post date: [January 17, 2022, 11:08am UTC](https://discourse.paraview.org/t/new-to-paraview-and-i-need-help-with-understanding-the-data/8788/2 "2022-01-17T11:08:50Z")
please share an image of your pipeline browser
---
### Author:  [@seb](https://discourse.paraview.org/u/seb)
#### Post date: [January 17, 2022, 11:09am UTC](https://discourse.paraview.org/t/new-to-paraview-and-i-need-help-with-understanding-the-data/8788/3 "2022-01-17T11:09:59Z")
Sorry, but I don’t know what a pipeline browser is. So could you tell me what that is, and how to know mine.
---
### Author:  [@mwestphal](https://discourse.paraview.org/u/mwestphal)
#### Post date: [January 17, 2022, 11:12am UTC](https://discourse.paraview.org/t/new-to-paraview-and-i-need-help-with-understanding-the-data/8788/4 "2022-01-17T11:12:10Z")
You may want to read this document first, this will help you get started:
[http://www.paraview.org/files/v5.1/ParaViewGettingStarted-5.1.0.pdf](http://www.paraview.org/files/v5.1/ParaViewGettingStarted-5.1.0.pdf)
---
### Author:  [@seb](https://discourse.paraview.org/u/seb)
#### Post date: [January 17, 2022, 11:35am UTC](https://discourse.paraview.org/t/new-to-paraview-and-i-need-help-with-understanding-the-data/8788/5 "2022-01-17T11:35:58Z")
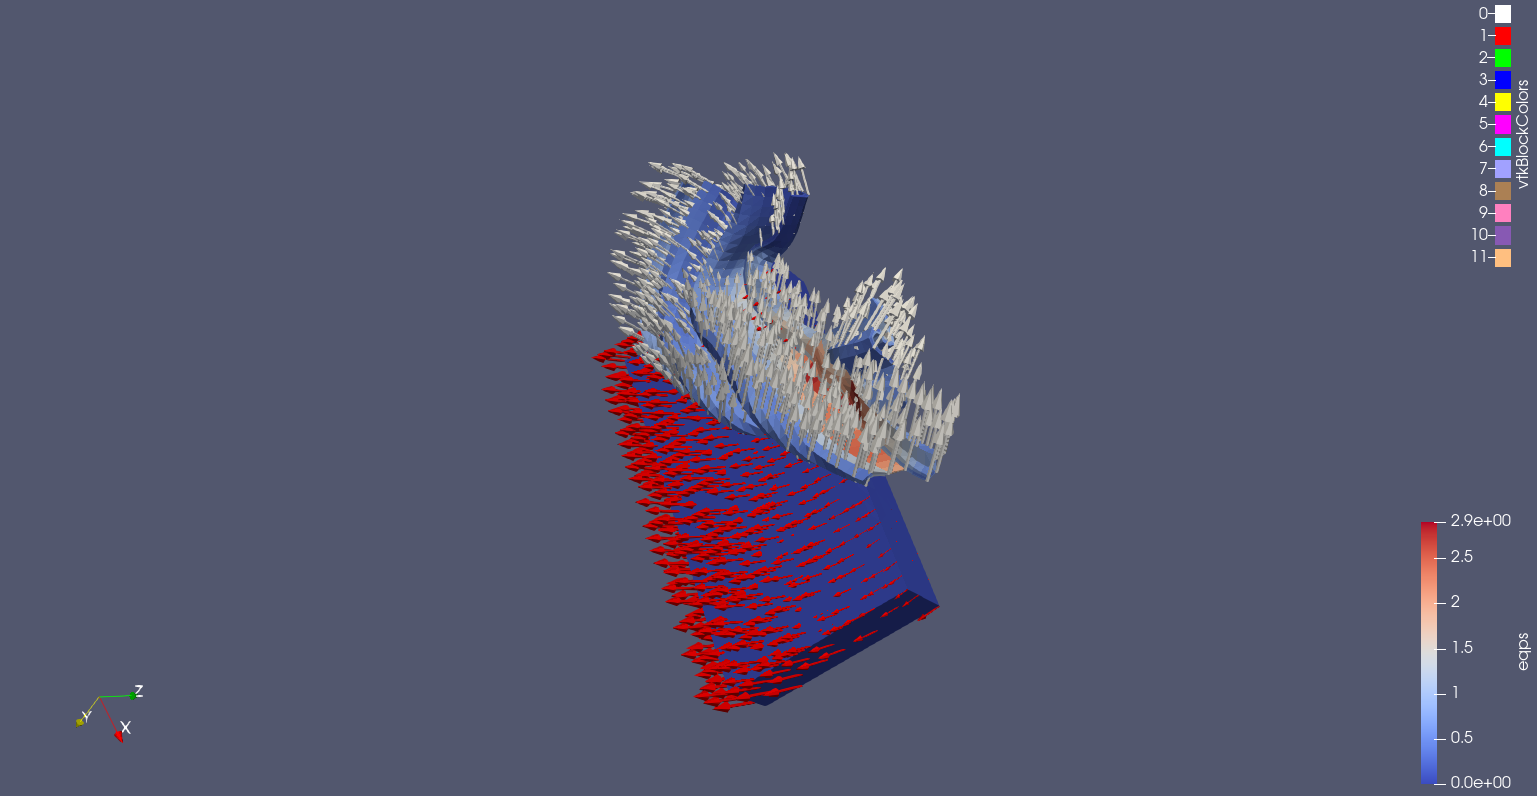
Here is the final result for me. I wasn’t able to properly follow step 8 because there was no option for “Vector” in Scale Mode, or an option called “Vectors”.
---
### Author:  [@mwestphal](https://discourse.paraview.org/u/mwestphal)
#### Post date: [January 17, 2022, 2:13pm UTC](https://discourse.paraview.org/t/new-to-paraview-and-i-need-help-with-understanding-the-data/8788/6 "2022-01-17T14:13:57Z")
Ok, what is your question then ?
Share what you are doing and what is not working more clearly.
---
### Author:  [@seb](https://discourse.paraview.org/u/seb)
#### Post date: [January 18, 2022, 4:35am UTC](https://discourse.paraview.org/t/new-to-paraview-and-i-need-help-with-understanding-the-data/8788/7 "2022-01-18T04:35:20Z")
To get that point what I did is put my model (stl) into paraview. Then I Extracted Surface from the Filters menu, also generated surface normals, and then added calculator for “Normals\_Y”. After that I went to filters and chose Integrate Variables to show a table.
My question is
What do the different variables on the table mean?
So for example, the Column labeled “Normals”, I want to know what that means and what units its in.
---
### Author:  [@mwestphal](https://discourse.paraview.org/u/mwestphal)
#### Post date: [January 18, 2022, 8:51am UTC](https://discourse.paraview.org/t/new-to-paraview-and-i-need-help-with-understanding-the-data/8788/8 "2022-01-18T08:51:23Z")
PointID: ID of the point, unique for each point
Drag: You computed it in the Calculator filter
Normals: A unit vector orthogonal to the surface of the cells surrounding the point ([Normal (geometry) - Wikipedia](https://en.wikipedia.org/wiki/Normal_(geometry)))
Points: 3D coordinates of the points
In ParaView, nothing has units, it’s always relative to your data or without intrinsic unit.
---
### Author:  [@seb](https://discourse.paraview.org/u/seb)
#### Post date: [January 18, 2022, 9:06am UTC](https://discourse.paraview.org/t/new-to-paraview-and-i-need-help-with-understanding-the-data/8788/9 "2022-01-18T09:06:08Z")
Thank you very much. That helped out a lot.