# no plot using .csv data
**URL:** https://discourse.paraview.org/t/no-plot-using-csv-data/7285
**Category:** ParaView Support
**Tags:** vtk
**Created:** [May 25, 2021, 3:36am UTC](https://discourse.paraview.org/t/no-plot-using-csv-data/7285 "2021-05-25T03:36:30Z")
**Posts on this page:** 9
**Page:** 1
### Author:  [@aquanaut](https://discourse.paraview.org/u/aquanaut)
#### Post date: [May 25, 2021, 3:36am UTC](https://discourse.paraview.org/t/no-plot-using-csv-data/7285/1 "2021-05-25T03:36:30Z")
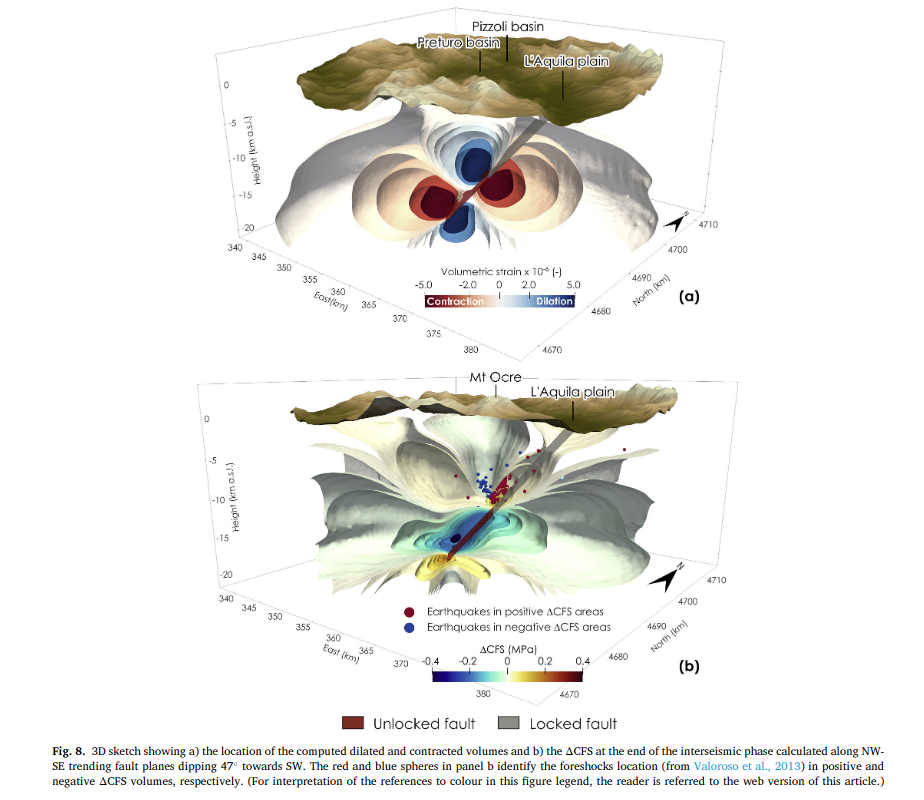
Why I can’t got the plot using this .csv data?
> **[Stress\_LAquila.csv](https://drive.google.com/file/d/14k2NcJSixSUPR9d5eBuBVwJJ_8uBWuD2/view?usp=sharing)**
>
> Google Drive file.
---
### Author:  [@mwestphal](https://discourse.paraview.org/u/mwestphal)
#### Post date: [May 31, 2021, 7:42am UTC](https://discourse.paraview.org/t/no-plot-using-csv-data/7285/2 "2021-05-31T07:42:21Z")
what did you try ?
---
### Author:  [@aquanaut](https://discourse.paraview.org/u/aquanaut)
#### Post date: [June 6, 2021, 11:00am UTC](https://discourse.paraview.org/t/no-plot-using-csv-data/7285/3 "2021-06-06T11:00:39Z")

Table to structed grid will turn out error.
---
### Author:  [@aquanaut](https://discourse.paraview.org/u/aquanaut)
#### Post date: [July 7, 2021, 8:59am UTC](https://discourse.paraview.org/t/no-plot-using-csv-data/7285/4 "2021-07-07T08:59:06Z")
hi Mathieu,could you please give me some advice?
---
### Author:  [@mwestphal](https://discourse.paraview.org/u/mwestphal)
#### Post date: [July 7, 2021, 9:00am UTC](https://discourse.paraview.org/t/no-plot-using-csv-data/7285/5 "2021-07-07T09:00:10Z")
In this case I’d use RessampleToImage, but I had little success with your data so far and no more time to spend on it, sorry.
---
### Author:  [@aquanaut](https://discourse.paraview.org/u/aquanaut)
#### Post date: [July 19, 2021, 9:40am UTC](https://discourse.paraview.org/t/no-plot-using-csv-data/7285/6 "2021-07-19T09:40:57Z")
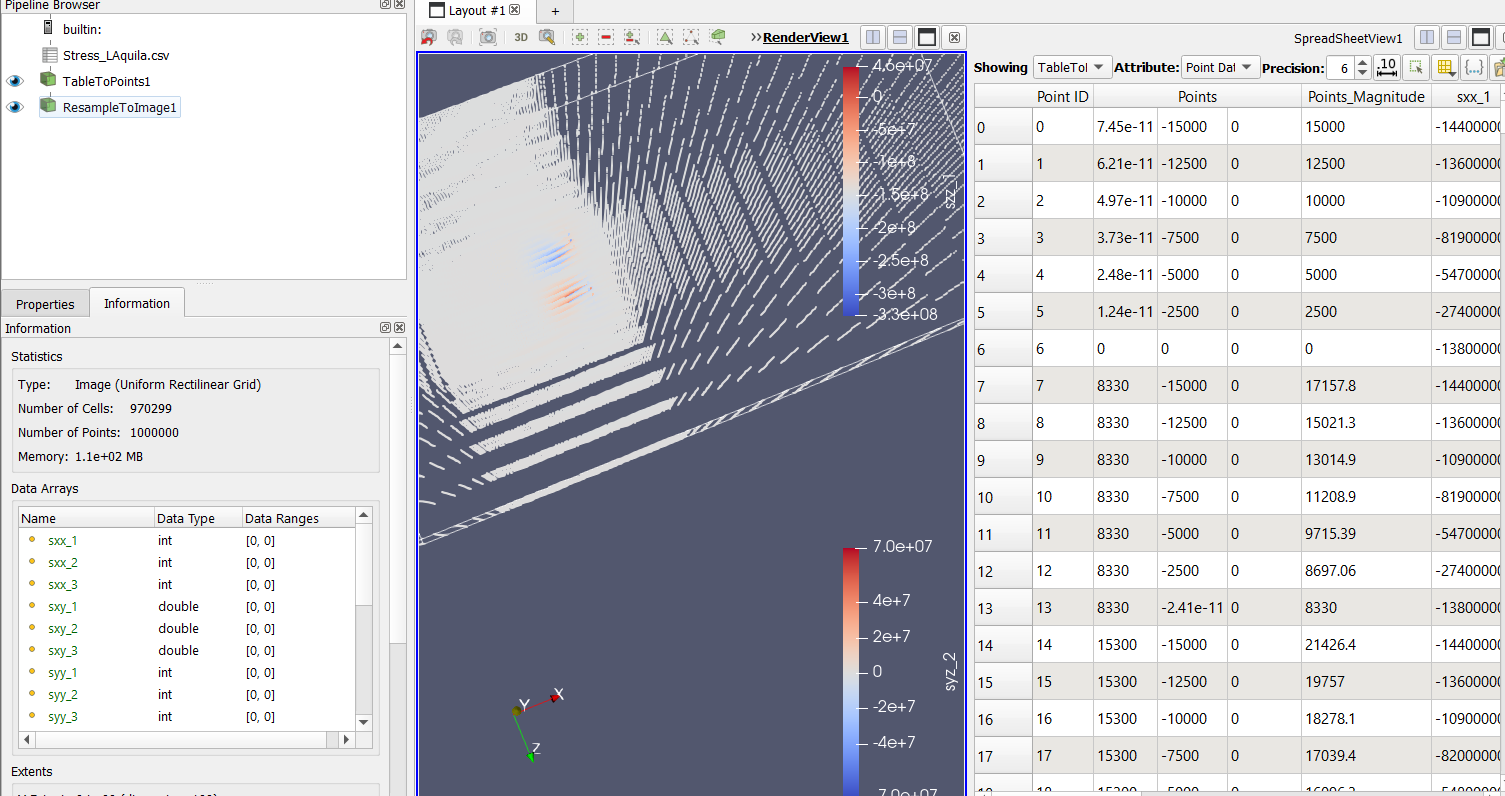
There is no data filtering with Ressample to Image.
---
### Author:  [@Kenneth\_Moreland](https://discourse.paraview.org/u/Kenneth_Moreland)
#### Post date: [July 19, 2021, 12:38pm UTC](https://discourse.paraview.org/t/no-plot-using-csv-data/7285/7 "2021-07-19T12:38:08Z")
When you use `Table to Points`, it just creates data at the specified points in space. Everything between those points is just empty space. The `Resample to Image` filter is looking specifically at different points in space, which are just empty. For `Resample to Image` to work, you need a cell structure that allows data to be interpolated in space, which `Table to Points` does not provide.
I think the simplest solution is to use the `Point Volume Interpolator`, which will splat your points on a grid.
---
### Author:  [@wascott](https://discourse.paraview.org/u/wascott)
#### Post date: [July 28, 2021, 1:00am UTC](https://discourse.paraview.org/t/no-plot-using-csv-data/7285/8 "2021-07-28T01:00:11Z")
Thanks for the tip Ken, I was just looking for this. I notice that the Point Volume Interpolator really doen’t - it tends to put Point data into elements until it gets half way to the next Point. Only the elements in the exact middle are “interpolated”. Shouldn’t this filter either really interpolate between points as it moves over elements, or have that as an option?
---
### Author:  [@Kenneth\_Moreland](https://discourse.paraview.org/u/Kenneth_Moreland)
#### Post date: [July 28, 2021, 1:17pm UTC](https://discourse.paraview.org/t/no-plot-using-csv-data/7285/9 "2021-07-28T13:17:25Z")
I’m not sure I understand your point. Yes, if you use a Gaussian kernel with the `Point Volume Interpolator` then you can have gaps or overlaps in the sampling. But I think with the Voronoi kernel it finds the nearest point each time, so you don’t get those gaps.
Of course, you could always use the `Delaunay 3D` filter instead. That will preserve the original sampling of the data. But it is a more computationally intensive algorithm and could cause problems with larger data or in parallel.
For the data attached to this question, I ran both the `Point Volume Interpolator` (with Voronoi kernel) and `Delaunay 3D`. Despite the fact that the points are irregularly spaced, the two are visually similar.
