# NOOB - calculation question
**URL:** https://discourse.paraview.org/t/noob-calculation-question/8609
**Category:** ParaView Support
**Created:** [December 10, 2021, 8:27pm UTC](https://discourse.paraview.org/t/noob-calculation-question/8609 "2021-12-10T20:27:50Z")
**Posts on this page:** 8
**Page:** 1
### Author:  [@BikerJoe](https://discourse.paraview.org/u/BikerJoe)
#### Post date: [December 10, 2021, 8:27pm UTC](https://discourse.paraview.org/t/noob-calculation-question/8609/1 "2021-12-10T20:27:50Z")
Hello forum,
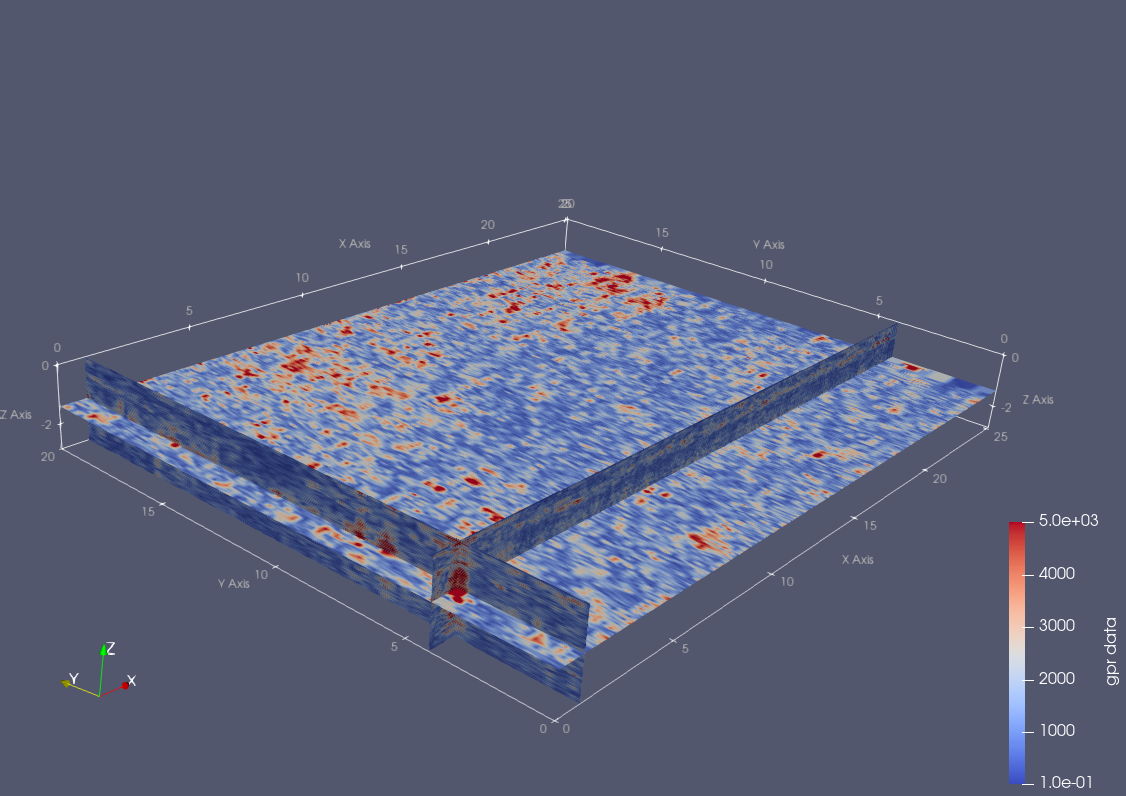
I am new to this powerful software and I am trying to do my first calculation. Data is x,y,z grid of points and over the whole x,y range i would like to calculate RMS for a given z interval. Can you guide me with a walkthrough?
I can even settle for a max, or mean of the z interval, as long as I get a single z value at the end.
Is there a place to better understand the buttons in the calculation box, possibly through examples?
thank you
---
### Author:  [@nicolas.vuaille](https://discourse.paraview.org/u/nicolas.vuaille)
#### Post date: [December 13, 2021, 8:57am UTC](https://discourse.paraview.org/t/noob-calculation-question/8609/2 "2021-12-13T08:57:49Z")
You can find documentation on the web. The part about Filters is here: [5. Filtering Data — ParaView Documentation 5.9.1 documentation](https://docs.paraview.org/en/latest/UsersGuide/filteringData.html), with some details on the `Calculator` filter.
You can also take a look to the `Statistic` filters.
---
### Author:  [@Kenneth\_Moreland](https://discourse.paraview.org/u/Kenneth_Moreland)
#### Post date: [December 13, 2021, 3:20pm UTC](https://discourse.paraview.org/t/noob-calculation-question/8609/3 "2021-12-13T15:20:38Z")
If you have not seen it, you might want to check out the `Extract Subset`
 to first extract the volume of interest (`VOI`) region of values that you want to compute on first. Doing that will make it easier to apply subsequent filters that compute the statistics you want.
---
### Author:  [@BikerJoe](https://discourse.paraview.org/u/BikerJoe)
#### Post date: [December 13, 2021, 4:04pm UTC](https://discourse.paraview.org/t/noob-calculation-question/8609/4 "2021-12-13T16:04:36Z")
thank you - deeper reading has been helpful. How is the Statistics filter applied once I isolate the z data? 🙂
---
### Author:  [@Kenneth\_Moreland](https://discourse.paraview.org/u/Kenneth_Moreland)
#### Post date: [December 13, 2021, 4:15pm UTC](https://discourse.paraview.org/t/noob-calculation-question/8609/5 "2021-12-13T16:15:01Z")
You can use the `Descriptive Statistics` filter to compute basic statistics like mean, min, max, and some more. I don’t think it computes RMS, but you could use the `Calculator` filter to first square the field to get the mean square.
I think adding the `Python Calculator` with the expression `sqrt(mean(fieldname*fieldname))` (replacing `fieldname` with the actual name of the field) will compute the RMS. The filter will stupidly repeat the RMS on every point of your data, but you can easily see the value in the `Information` tab.
---
### Author:  [@BikerJoe](https://discourse.paraview.org/u/BikerJoe)
#### Post date: [December 13, 2021, 11:49pm UTC](https://discourse.paraview.org/t/noob-calculation-question/8609/6 "2021-12-13T23:49:14Z")
Using the Descriptive Statistics I get single values, but I am looking for a map.
I used Python Calculator and got the same volume returned to me with one value using the expression “mean(fieldname)” just to keep it simple. Below you can see my data has x,y,z dimension and I want to calculate the mean of all points in the z space “0 to 255 (dimension: 256)”. Should be a map. What am I missing, and thank you for your previous reply and help.
0 to 18 (dimension: 19)
0 to 1,023 (dimension: 1,024)
0 to 255 (dimension: 256)
---
### Author:  [@Kenneth\_Moreland](https://discourse.paraview.org/u/Kenneth_Moreland)
#### Post date: [December 14, 2021, 3:03pm UTC](https://discourse.paraview.org/t/noob-calculation-question/8609/7 "2021-12-14T15:03:11Z")
Um, I’m not sure I understand what you are trying to do. Are you trying to convert your 19x1024x256 dataset to a 19x1024 dataset with an RMS (or other aggregate) over all the z values at that x,y?
There is no real mechanism to do that in ParaView. You might be able to play some tricks with animating a VOI and then doing temporal statistics. But ultimately, this sounds like it requires special coding in a `Programmable Filter`.
---
### Author:  [@BikerJoe](https://discourse.paraview.org/u/BikerJoe)
#### Post date: [December 14, 2021, 3:13pm UTC](https://discourse.paraview.org/t/noob-calculation-question/8609/8 "2021-12-14T15:13:22Z")
Yep, you got what I am trying to accomplish. Thanks for giving it a try, I am coming from a seismic interpretation background and RMS is something done often. I will have to work with what I have or do some serious data gymnastics 🙂