# One color between ticks
**URL:** https://discourse.paraview.org/t/one-color-between-ticks/11929
**Category:** ParaView Support
**Created:** [April 19, 2023, 7:34pm UTC](https://discourse.paraview.org/t/one-color-between-ticks/11929 "2023-04-19T19:34:49Z")
**Posts on this page:** 3
**Page:** 1
### Author:  [@ncarm8na](https://discourse.paraview.org/u/ncarm8na)
#### Post date: [April 19, 2023, 7:34pm UTC](https://discourse.paraview.org/t/one-color-between-ticks/11929/1 "2023-04-19T19:34:49Z")
Hi
I need to edit my color bar for analysis in mining stress models. Specify i need to visualize just one color between each ticks. I already select the ticks manualy in use custom labels like:

But, i see to much colors between ticks, i need some like:
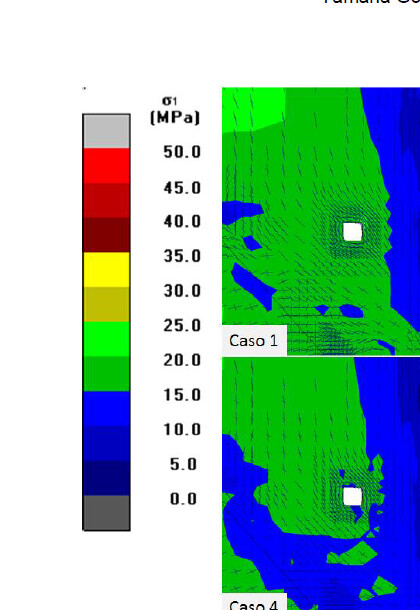
I hope you can help me
---
### Author:  [@Christos\_Tsolakis](https://discourse.paraview.org/u/Christos_Tsolakis)
#### Post date: [April 19, 2023, 11:13pm UTC](https://discourse.paraview.org/t/one-color-between-ticks/11929/2 "2023-04-19T23:13:38Z")
The color varies across the cell because your data array is associated with points instead of cells, try to apply the `PointDataToCellData` filter to obtain a fixed value per cell . Also, in the color map editor panel you have already open scroll down to “Color Discretization” enable Discretize and reduce the number of table values to something like 12 of your example.
---
### Author:  [@Kenneth\_Moreland](https://discourse.paraview.org/u/Kenneth_Moreland)
#### Post date: [April 20, 2023, 2:44pm UTC](https://discourse.paraview.org/t/one-color-between-ticks/11929/3 "2023-04-20T14:44:13Z")
I think the question is about making the regions of colors in the color bar homogeneous between the tics in the colorbar, but they can change in between cells.
This has been a long standing request and is an open issue: [https://gitlab.kitware.com/paraview/paraview/-/issues/17641](https://gitlab.kitware.com/paraview/paraview/-/issues/17641). Unfortunately, the implementation is not trivial, and it has been pushed back for about 5 years now.
For now, you just have to create the color map with constant color regions that match the tics yourself. There are a couple ways to do this.
The first way is to use the `Color Discretization` controls at the bottom of the `Color Map Editor`. It looks like you are already doing this, but if you set it for 8, that should match the 9 tics you have in the color bar. You may have to set a specific range to ensure that the tic spacing matches the color spacing, but it should work fine for your 0 – 40 range.
The second way is to change the colormap itself to have stepped colors. You can change `Color Space` to `Step` and then set a control point at each tic value with the color you want for the range below that tic. This gives you a lot of control, but is tough to apply color values from maps like the one you selected.
Unfortunately, both of these methods are vulnerable to the tics being changed if the color legend is moved or the view resized.