# OSPRay colouring materials by scalar
**URL:** https://discourse.paraview.org/t/ospray-colouring-materials-by-scalar/1846
**Category:** Development
**Tags:** vtk
**Created:** [May 13, 2019, 3:57pm UTC](https://discourse.paraview.org/t/ospray-colouring-materials-by-scalar/1846 "2019-05-13T15:57:37Z")
**Posts on this page:** 13
**Page:** 1
### Author:  [@Daan\_van\_Vugt](https://discourse.paraview.org/u/Daan_van_Vugt)
#### Post date: [May 13, 2019, 3:57pm UTC](https://discourse.paraview.org/t/ospray-colouring-materials-by-scalar/1846/1 "2019-05-13T15:57:37Z")
Hi,
I’m using VTK 8.2.0 and OSPRay 1.8.5 from python to show some particle traces (using the Tube filter).
I’m having trouble transferring my colour map to the ray tracer. The particle traces remain black.
Is there a way to transfer the colour properties from my cells to the material OSPRay will use to render?
Or must I have static material properties?
The suggestion by @Dave_DeMarle in [How to set up material lookuptable for OSPRay](https://discourse.paraview.org/t/how-to-set-up-material-lookuptable-for-ospray/56) also doesn’t work out for me yet, but might work since I have a discrete colourmap in mind.
Any input is welcome,
Thanks,
Daan
ps: I create a material lookup table (Value Indexed) as follows:
```
def W_lut(n_Z=74):
import matplotlib
import matplotlib.cm as cm
lut = vtk.vtkLookupTable()
lut.SetNumberOfTableValues(n_Z+1)
lut.Build()
norm = matplotlib.colors.Normalize(vmin=0,vmax=74,clip=True)
mapper = cm.ScalarMappable(norm=norm, cmap=cm.inferno)
ll = []
for i, u in enumerate(range(75)):
lut.SetTableValue(i, mapper.to_rgba(u))
ll.append('W_%d'%(i,))
lut.Annotations = ll
lut.InterpretValuesAsCategories = 1
return lut
```
and create the materials as:
```
# Add colormap variables (75 discrete levels)
import matplotlib
import matplotlib.cm as cm
norm = matplotlib.colors.Normalize(vmin=0,vmax=74,clip=True)
mapper = cm.ScalarMappable(norm=norm, cmap=cm.inferno)
for i, u in enumerate(range(75)):
name = 'W_%d'%(i,)
ml.AddMaterial(name, "Alloy")
ml.AddShaderVariable(name, "color", 3, mapper.to_rgba(u)[0:3])
```
---
### Author:  [@Dave\_DeMarle](https://discourse.paraview.org/u/Dave_DeMarle)
#### Post date: [May 13, 2019, 4:31pm UTC](https://discourse.paraview.org/t/ospray-colouring-materials-by-scalar/1846/2 "2019-05-13T16:31:19Z")
Hi Daan.
A couple of thoughts.
1: you probably don’t need the tube filter. OSPRay will render streamlines directly as tubes. You can control the width of the tube via vtkProperty::LineWidth (constant width) or by applying a scaling array (width is a function of some scalar). See [https://gitlab.kitware.com/vtk/vtk/blob/master/Rendering/RayTracing/Testing/Cxx/TestOSPRayImplicits.cxx](https://gitlab.kitware.com/vtk/vtk/blob/master/Rendering/RayTracing/Testing/Cxx/TestOSPRayImplicits.cxx)
2: Do you need special materials (reflective/refractive/variable appearance)? If not the default OBJMaterial should do color mapping just like a normal VTK render will for any point or cell aligned array. See [https://gitlab.kitware.com/vtk/vtk/blob/master/Rendering/RayTracing/Testing/Cxx/TestOSPRayRenderMesh.cxx](https://gitlab.kitware.com/vtk/vtk/blob/master/Rendering/RayTracing/Testing/Cxx/TestOSPRayRenderMesh.cxx) and run it with the -type and -rep command line arguments to draw the spheres with lines instead of triangle/surfaces.
3: If you do need fancy materials and are aware of 2, then let me know and I’ll look harder at your script to try and see what is going wrong.
hth
---
### Author:  [@Daan\_van\_Vugt](https://discourse.paraview.org/u/Daan_van_Vugt)
#### Post date: [May 14, 2019, 1:36pm UTC](https://discourse.paraview.org/t/ospray-colouring-materials-by-scalar/1846/3 "2019-05-14T13:36:30Z")
Hi Dave,
Thanks for the quick suggestions. I think I’ll keep the tube filter since it looks better in the OpenGL renderer we use to setup the scenes.
I don’t need any special properties, this was all just trickery to try to get colours.
I’ve just tried with OBJMaterial, which comes out very white instead of coloured.
See the renders below:
 
the renderer is just setup as
```
if not self.ospray: self.ospray = vtk.vtkOSPRayPass()
self.parent.renderer.SetPass(self.ospray)
self.render_node.SetSamplesPerPixel(1, self.parent.renderer)
#self.render_node.SetAmbientSamples(1, self.parent.renderer)
self.render_node.SetRendererType(osp_renderer,self.parent.renderer)
self.parent.renderer.SetBackground(0.9, 0.9, 0.9)
self.parent.renderer.SetBackground2(0.9, 0.9, 1.0)
```
---
### Author:  [@Dave\_DeMarle](https://discourse.paraview.org/u/Dave_DeMarle)
#### Post date: [May 14, 2019, 3:00pm UTC](https://discourse.paraview.org/t/ospray-colouring-materials-by-scalar/1846/4 "2019-05-14T15:00:55Z")
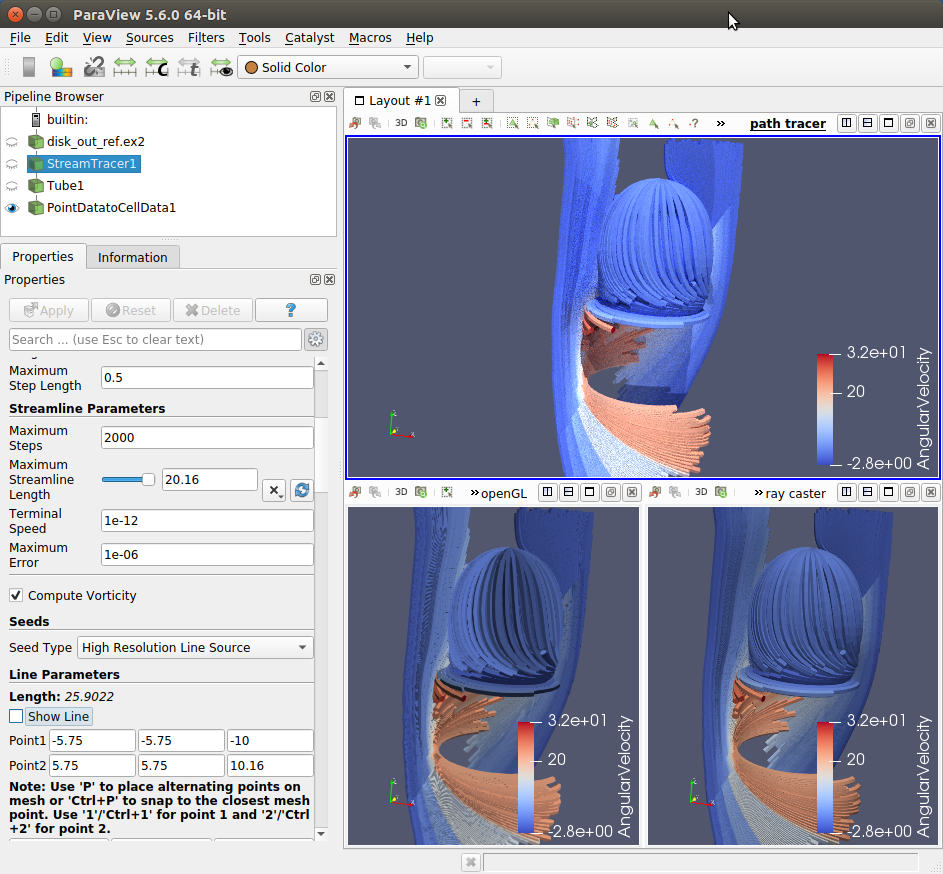
Can you share the parts of the code where you set up the mapper and lookup table? In particular, you shouldn’t need to set any material or special color map at all. The way it should work is that if the only thing you do is set the ospray pass, the vtk2ospray code c++ will internally make and setup an ospray::OBJMaterial such that color mapping will work and you will get an image that looks very similar to the gl rendered image you would have without OSPRay.
To demonstrate, open paraview, open the diskoutref.ex2 sample data set, apply streamlines and tube (optionally point to cell filter), color by some array, and turn on ospray.
---
### Author:  [@Daan\_van\_Vugt](https://discourse.paraview.org/u/Daan_van_Vugt)
#### Post date: [May 14, 2019, 3:08pm UTC](https://discourse.paraview.org/t/ospray-colouring-materials-by-scalar/1846/5 "2019-05-14T15:08:36Z")
Hi Dave,
This is how I create the dataset (particle positions at many times)
```
# n_p * n_t, 3
pcoords = npvtk.numpy_to_vtk(xyz[:,:,:].reshape(-1,3), deep=True, array_type=vtk.VTK_FLOAT)
self.points = vtk.vtkPoints()
self.points.SetData(pcoords)
# n_p * n_t
q = npvtk.numpy_to_vtk(np.asarray(self.particles.q[0:n_p,:]).ravel(), deep=True, array_type=vtk.VTK_FLOAT)
q.SetName('q')
vtk_points.poly = vtk.vtkPolyData()
vtk_points.poly.SetPoints(self.points)
vtk_points.poly.GetPointData().AddArray(q)
vtk_points.poly.GetPointData().SetActiveScalars('q')
# Set connectivity data per particle
lines = vtk.vtkCellArray()
# See https://vtk.org/Wiki/VTK/Examples/Python/GeometricObjects/Display/PolyLine
for i in range(n_p):
lines.InsertNextCell(n_t, range(n_t*i, n_t*i+n_t))
vtk_points.poly.SetLines(lines)
vtk_points.lut = vtk_lut.W_lut() #as in first post on discourse
tube = vtk.vtkTubeFilter()
tube.SetInputData(vtk_points.poly)
tube.SetNumberOfSides(6)
tube.SetVaryRadiusToVaryRadiusOff()
tube.SetRadius(0.015)
vtk_points.mapper = vtk.vtkPolyDataMapper()
vtk_points.mapper.SetInputConnection(tube.GetOutputPort())
vtk_points.mapper.ScalarVisibilityOn()
vtk_points.mapper.SetScalarRange(vtk_points.poly.GetPointData().GetArray('q').GetRange())
vtk_points.mapper.SetLookupTable(vtk_points.lut)
vtk_points.actor = vtk.vtkActor()
vtk_points.actor.SetMapper(vtk_points.mapper)
#vtk_points.actor.GetProperty().SetMaterialName("Value Indexed")
vtk_points.actor.GetProperty().SetMaterialName("OBJMaterial")
vtk_points.colorbar = vtk_color_bar()
vtk_points.colorbar.SetLookupTable(vtk_points.lut)
vtk_points.colorbar.SetTitle('q')
vtk_points.colorbar.SetPosition(0.05, 0.1)
return vtk_points
```
---
### Author:  [@Dave\_DeMarle](https://discourse.paraview.org/u/Dave_DeMarle)
#### Post date: [May 14, 2019, 3:18pm UTC](https://discourse.paraview.org/t/ospray-colouring-materials-by-scalar/1846/6 "2019-05-14T15:18:09Z")
Try commenting out this line
vtk\_points.actor.GetProperty().SetMaterialName(“OBJMaterial”)
---
### Author:  [@Daan\_van\_Vugt](https://discourse.paraview.org/u/Daan_van_Vugt)
#### Post date: [May 14, 2019, 3:21pm UTC](https://discourse.paraview.org/t/ospray-colouring-materials-by-scalar/1846/7 "2019-05-14T15:21:45Z")
That gives me a very interesting picture, where the lines are black
and I guess there is no data on many of the points on the solid material below

---
### Author:  [@Dave\_DeMarle](https://discourse.paraview.org/u/Dave_DeMarle)
#### Post date: [May 14, 2019, 5:49pm UTC](https://discourse.paraview.org/t/ospray-colouring-materials-by-scalar/1846/8 "2019-05-14T17:49:41Z")
Try turning off the annotations and categorical nature of the color map please. Either should be OK I think but you could be exercising a code path/bug I haven’t seen yet.
> [@Daan\_van\_Vugt](#):
>
> lut.Annotations = ll lut.InterpretValuesAsCategories = 1
Since the color is too dark it might be something odd like inverted normals on the tube filter but that seems unlikely. In general I find a good trick to debugging things is to insert writers into the code and open the output up in paraview to debug what you are looking at.
I’m stumped at the moment otherwise.
---
### Author:  [@Daan\_van\_Vugt](https://discourse.paraview.org/u/Daan_van_Vugt)
#### Post date: [May 21, 2019, 7:40am UTC](https://discourse.paraview.org/t/ospray-colouring-materials-by-scalar/1846/9 "2019-05-21T07:40:19Z")
I’ve tried the annotations and categorical nature without any difference.
Saving the tubes with a vtkPDataSetWriter and opening in paraview 5.6.0 works,
and there I can OSPRay without any issue and get nice colours. We probably did something wrong in setting up the ray tracer (or in my own build of OSPRay and VTK 8.2.0).
I will try to get our stl files into paraview and render from there.
---
### Author:  [@Alex\_Bafkar](https://discourse.paraview.org/u/Alex_Bafkar)
#### Post date: [September 11, 2019, 11:34am UTC](https://discourse.paraview.org/t/ospray-colouring-materials-by-scalar/1846/10 "2019-09-11T11:34:35Z")
Hello guys,
I am trying to visualise the particles path in my model and I only have 8 time steps for an unsteady flow. I also have the CSV file with the coordinates of each particles for these time steps. I can read the particles and visualise them, but when I try to use the streaklines Paraview crashes.
I need to see the particle path let say after 2 s, something similar to @Daan_van_Vugt work.
I really appreciate your support.
Best,
Alex
---
### Author:  [@Daan\_van\_Vugt](https://discourse.paraview.org/u/Daan_van_Vugt)
#### Post date: [September 11, 2019, 2:42pm UTC](https://discourse.paraview.org/t/ospray-colouring-materials-by-scalar/1846/11 "2019-09-11T14:42:47Z")
If you add a line at the beginning of the script given in [OSPRay colouring materials by scalar](https://discourse.paraview.org/t/ospray-colouring-materials-by-scalar/1846/5) so xyz comes from your CSV file you should be able to draw lines between your particle positions.
Something like
```
import csv
with open('positions_particle_1.csv', 'rb') as csvfile:
reader = csv.reader(csvfile)
for i, row in enumerate(spamreader):
xyz[0,i,0:3] = row
```
then you can write out the lines to vtk using something like the below:
```
vtk_points.poly.SetLines(lines)
writer = vtk.vtkPolyDataWriter()
writer.SetInputData(vtk_points.GetOutput())
writer.SetFileName('lines.vtk')
writer.Update()
```
Good luck!
---
### Author:  [@Alex\_Bafkar](https://discourse.paraview.org/u/Alex_Bafkar)
#### Post date: [September 15, 2019, 2:05pm UTC](https://discourse.paraview.org/t/ospray-colouring-materials-by-scalar/1846/12 "2019-09-15T14:05:55Z")
Thanks Dan,
I tried the following script in paraview as you suggested but it doesn’t work and complaining about the CSV (line2) and return(last line). my csv file has 4 columns (time, X,Y,Z).
Sorry, I am new with Paraview and learning Python, could you please help me with this.
#################################
```
import csv
with open('para.csv', 'rb') as csvfile:
reader = csv.reader(csvfile)
for i, row in enumerate(spamreader):
xyz[0,i,0:3] = row
vtk_points.poly.SetLines(lines)
writer = vtk.vtkPolyDataWriter()
writer.SetInputData(vtk_points.GetOutput())
writer.SetFileName('lines.vtk')
writer.Update()
# n_p * n_t, 3
pcoords = npvtk.numpy_to_vtk(xyz[:,:,:].reshape(-1,3), deep=True, array_type=vtk.VTK_FLOAT)
self.points = vtk.vtkPoints()
self.points.SetData(pcoords)
# n_p * n_t
q = npvtk.numpy_to_vtk(np.asarray(self.particles.q[0:n_p,:]).ravel(), deep=True, array_type=vtk.VTK_FLOAT)
q.SetName('q')
vtk_points.poly = vtk.vtkPolyData()
vtk_points.poly.SetPoints(self.points)
vtk_points.poly.GetPointData().AddArray(q)
vtk_points.poly.GetPointData().SetActiveScalars('q')
# Set connectivity data per particle
lines = vtk.vtkCellArray()
# See https://vtk.org/Wiki/VTK/Examples/Python/GeometricObjects/Display/PolyLine
for i in range(n_p):
lines.InsertNextCell(n_t, range(n_t*i, n_t*i+n_t))
vtk_points.poly.SetLines(lines)
vtk_points.lut = vtk_lut.W_lut() #as in first post on discourse
tube = vtk.vtkTubeFilter()
tube.SetInputData(vtk_points.poly)
tube.SetNumberOfSides(6)
tube.SetVaryRadiusToVaryRadiusOff()
tube.SetRadius(0.015)
vtk_points.mapper = vtk.vtkPolyDataMapper()
vtk_points.mapper.SetInputConnection(tube.GetOutputPort())
vtk_points.mapper.ScalarVisibilityOn()
vtk_points.mapper.SetScalarRange(vtk_points.poly.GetPointData().GetArray('q').GetRange())
vtk_points.mapper.SetLookupTable(vtk_points.lut)
vtk_points.actor = vtk.vtkActor()
vtk_points.actor.SetMapper(vtk_points.mapper)
#vtk_points.actor.GetProperty().SetMaterialName("Value Indexed")
vtk_points.actor.GetProperty().SetMaterialName("OBJMaterial")
vtk_points.colorbar = vtk_color_bar()
vtk_points.colorbar.SetLookupTable(vtk_points.lut)
vtk_points.colorbar.SetTitle('q')
vtk_points.colorbar.SetPosition(0.05, 0.1)
print(vtk_points)
```
#########################################
THE CSV FILE CONTENTS:
```
Time X Y Z
0.00E+00 1.36E-02 -1.47E-01 -4.68E-01
0.00E+00 1.43E-02 -1.54E-01 -4.68E-01
0.00E+00 1.39E-02 -1.49E-01 -4.68E-01
0.00E+00 1.38E-02 -1.50E-01 -4.71E-01
0.00E+00 1.32E-02 -1.48E-01 -4.64E-01
0.00E+00 1.10E-02 -1.53E-01 -4.70E-01
0.00E+00 1.23E-02 -1.53E-01 -4.72E-01
0.00E+00 8.35E-03 -1.52E-01 -4.65E-01
0.00E+00 1.11E-02 -1.53E-01 -4.65E-01
0.00E+00 1.10E-02 -1.50E-01 -4.68E-01
0.00E+00 1.25E-02 -1.53E-01 -4.66E-01
0.00E+00 1.35E-02 -1.52E-01 -4.69E-01
0.00E+00 1.25E-02 -1.49E-01 -4.69E-01
0.00E+00 1.12E-02 -1.54E-01 -4.73E-01
0.00E+00 8.93E-03 -1.54E-01 -4.67E-01
0.00E+00 1.05E-02 -1.48E-01 -4.72E-01
0.00E+00 1.11E-02 -1.51E-01 -4.68E-01
0.00E+00 9.82E-03 -1.53E-01 -4.67E-01
0.00E+00 1.13E-02 -1.53E-01 -4.73E-01
```
Cheers
---
### Author:  [@Daan\_van\_Vugt](https://discourse.paraview.org/u/Daan_van_Vugt)
#### Post date: [September 17, 2019, 8:49am UTC](https://discourse.paraview.org/t/ospray-colouring-materials-by-scalar/1846/13 "2019-09-17T08:49:10Z")
Hello Alex,
I would recommend breaking the problem down in smaller chunks, instead of trying to run this entire script in the first try. Perhaps you can see (just by printing the xyz array) if you read your CSV file as expected?
I notice a few things here still: the indentation of `for i, row` is off, xyz is not defined yet, and n\_p also is not defined.
Then once you are sure that you have filled the xyz array correctly you can proceed to making the VTK output.
Good luck!
Daan