# Outline in charts
**URL:** https://discourse.paraview.org/t/outline-in-charts/17414
**Category:** ParaView Support
**Created:** [January 28, 2026, 3:21pm UTC](https://discourse.paraview.org/t/outline-in-charts/17414 "2026-01-28T15:21:05Z")
**Posts on this page:** 8
**Page:** 1
### Author:  [@ggf](https://discourse.paraview.org/u/ggf)
#### Post date: [January 28, 2026, 3:21pm UTC](https://discourse.paraview.org/t/outline-in-charts/17414/1 "2026-01-28T15:21:05Z")
Hi,
I’ve failed at finding the appropriate setting for drawing the outline/bounding box of a PlotOverLine filter in the line chart view.
I know how to toggle the grid, which kind of serves my purpose, but I would prefer the outline draw in the same thickness as the axes (as in matplotlib default plotting style). I have found a workaround by adding some _ghost_ lines (as in not actually drawn) in the top and right axes and then removing the axis labels, but there should be a more direct way, IMO.
Is there a toggle I’m missing or should this be a feature request?
Thanks in advance,
Guillermo
---
### Author:  [@mwestphal](https://discourse.paraview.org/u/mwestphal)
#### Post date: [January 29, 2026, 9:10am UTC](https://discourse.paraview.org/t/outline-in-charts/17414/2 "2026-01-29T09:10:53Z")
> [@ggf](#):
>
> outline/bounding box of a PlotOverLine filter in the line chart view.
I fail to see what this would look like, could you share an illustration ?
---
### Author:  [@ggf](https://discourse.paraview.org/u/ggf)
#### Post date: [January 29, 2026, 9:22am UTC](https://discourse.paraview.org/t/outline-in-charts/17414/3 "2026-01-29T09:22:36Z")
Hi,
I want exactly the opposite of what [this user](https://stackoverflow.com/questions/51268315/how-to-avoid-the-matplotlib-bounding-box) was trying to accomplish with matplotlib, i.e., matplotlib default bounding box style.
Hope that clears it up!
---
### Author:  [@mwestphal](https://discourse.paraview.org/u/mwestphal)
#### Post date: [January 29, 2026, 9:28am UTC](https://discourse.paraview.org/t/outline-in-charts/17414/4 "2026-01-29T09:28:19Z")
Like that ?
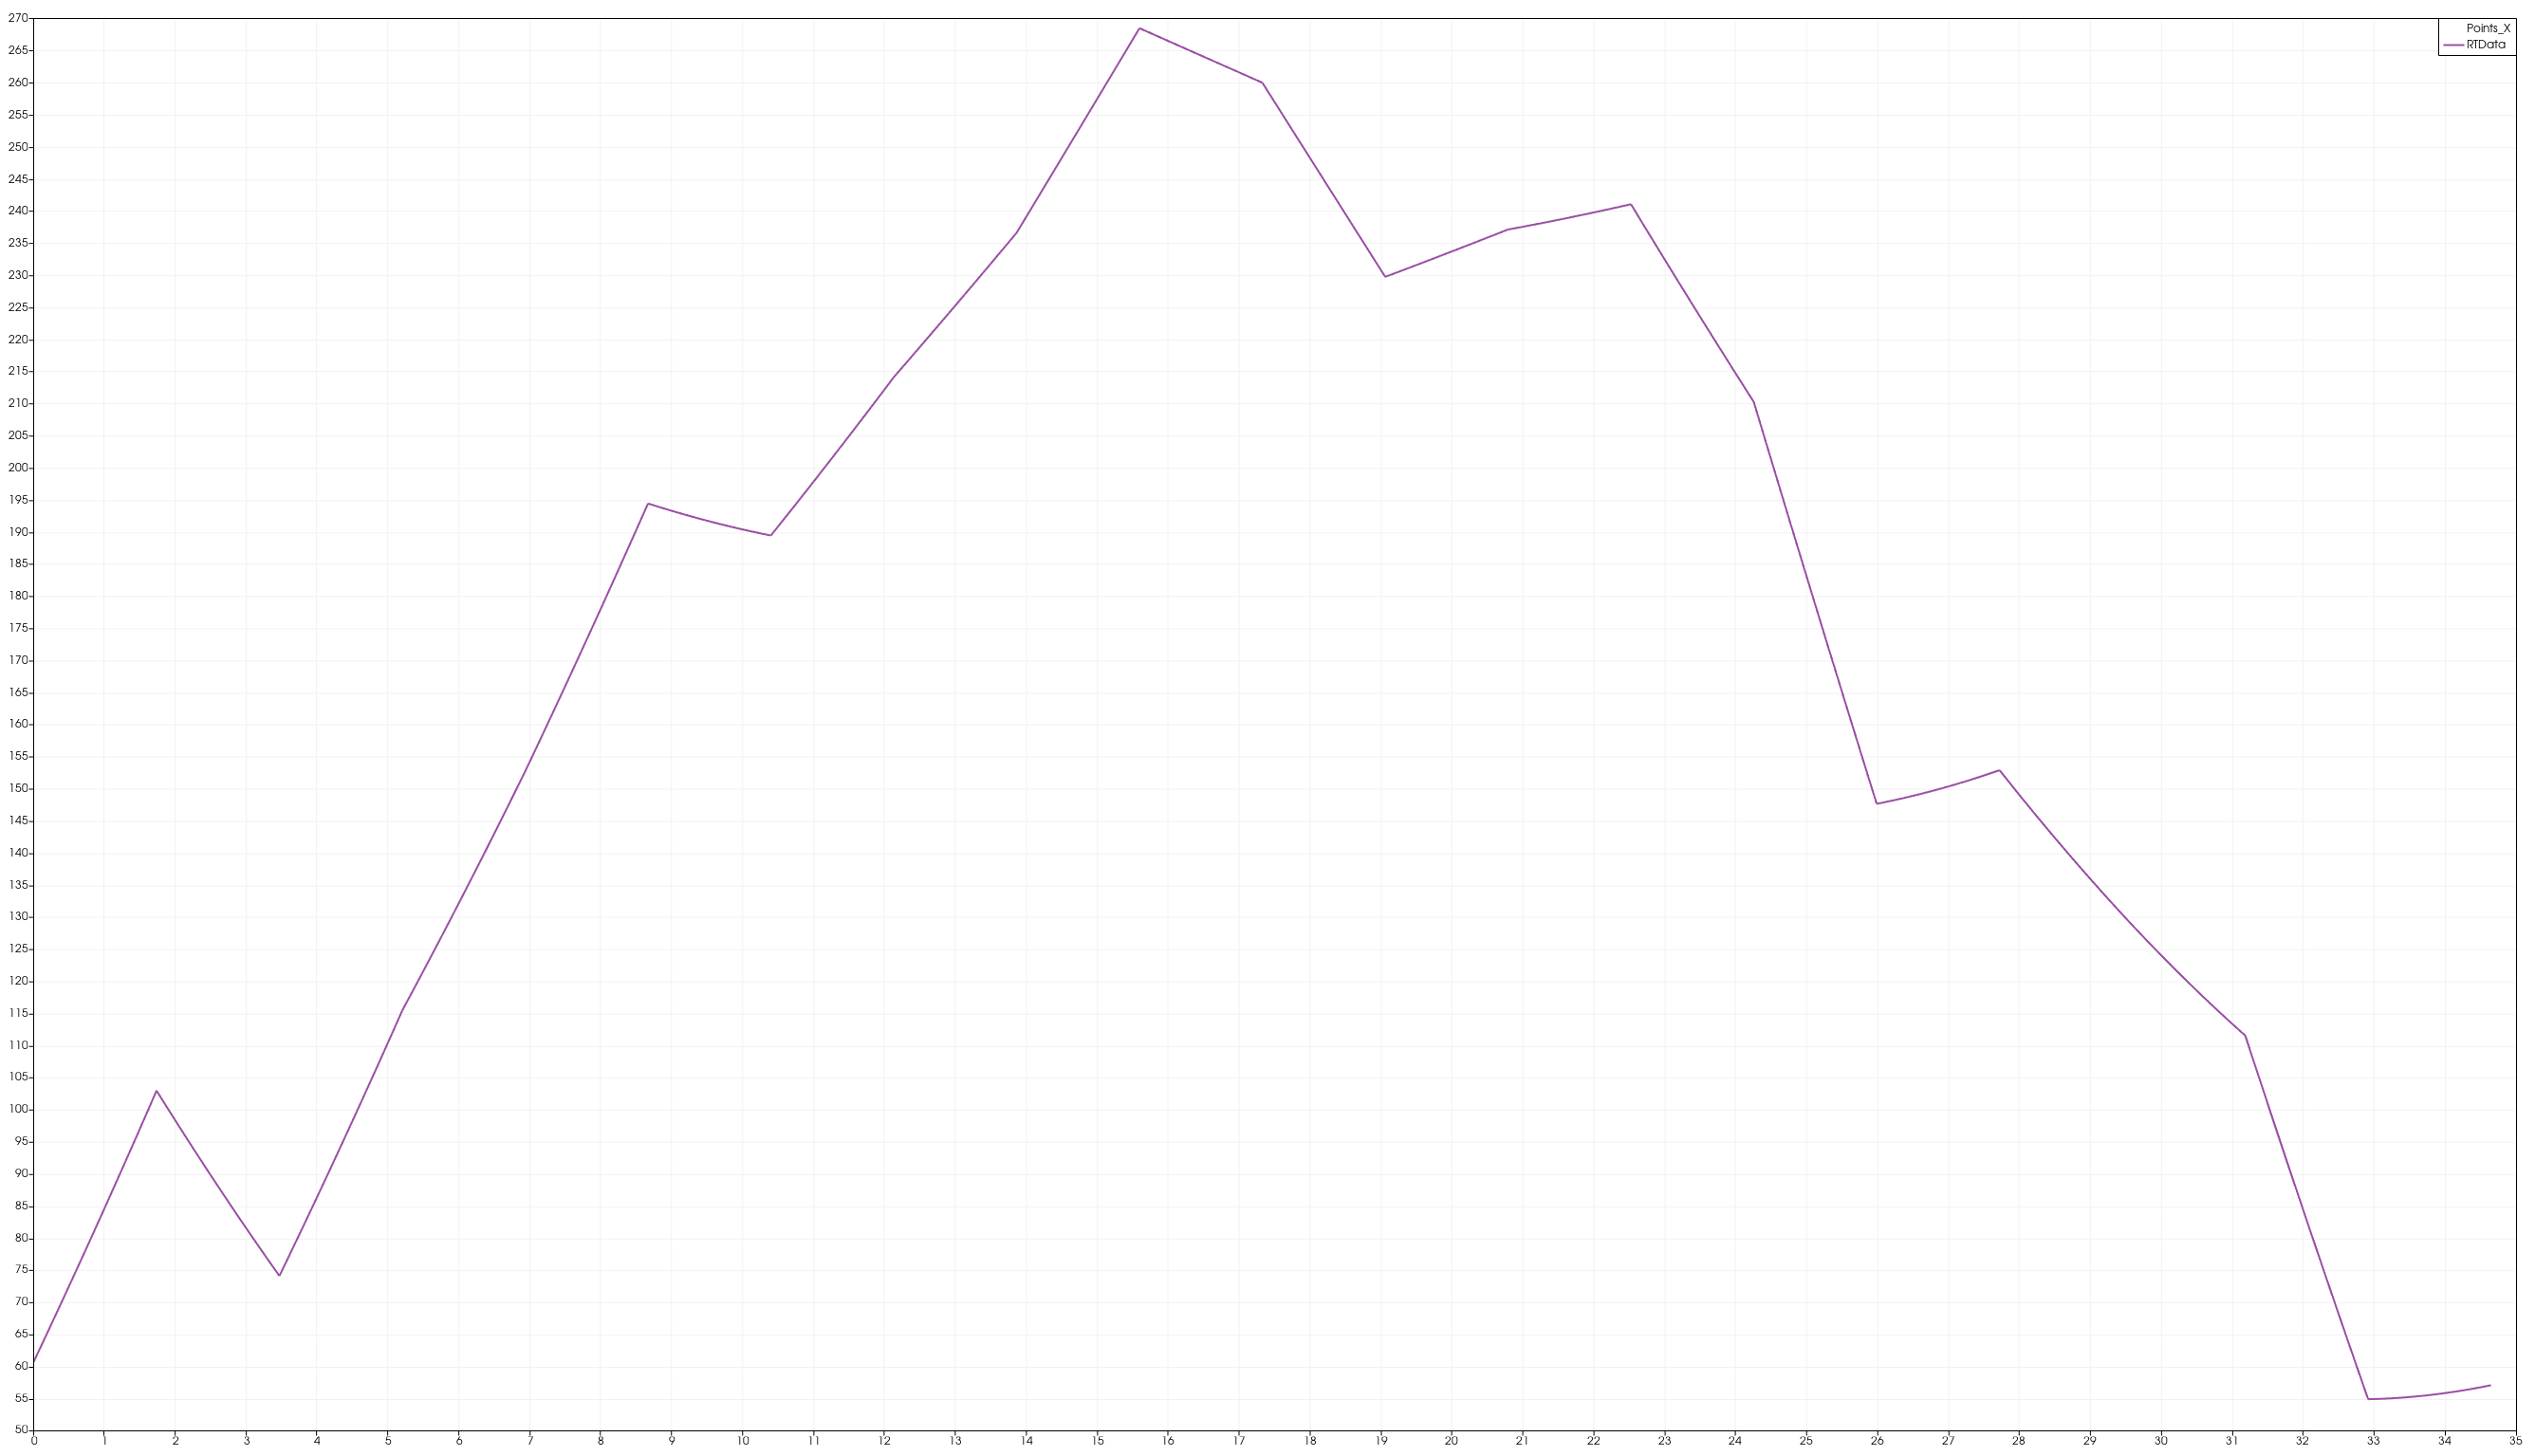
Its a bit hacky though, in short:
- Show another variable you dont need at all
- Set “Chart Axes” to “TopRight”
- Set opacity to zero
- Check TopAxisCustomLabels
- Check RightAxisCustomLabels
Sadly the variables appears in the legend, I did not find a way to hide it.
What you are asking for should be very easy to add to ParaView properly though.
---
### Author:  [@ggf](https://discourse.paraview.org/u/ggf)
#### Post date: [January 29, 2026, 9:33am UTC](https://discourse.paraview.org/t/outline-in-charts/17414/5 "2026-01-29T09:33:47Z")
Yeah, exactly like that. That’s kind of the workaround (yours is a bit more direct, though, so thanks!) I was trying to describe, but yeah, it feels hackish. I think a proper toggle to achieve that could be a nice addition.
Should I submit a feature request somewhere else?
---
### Author:  [@mwestphal](https://discourse.paraview.org/u/mwestphal)
#### Post date: [January 29, 2026, 9:37am UTC](https://discourse.paraview.org/t/outline-in-charts/17414/6 "2026-01-29T09:37:45Z")
> **[Feature Requests](https://discourse.paraview.org/c/feature-requests/14)**
>
> Request features for future versions of ParaView. If a feature you want to see in ParaView has already been added to this category, please vote for it by liking the first post in the topic.
---
### Author:  [@ggf](https://discourse.paraview.org/u/ggf)
#### Post date: [January 29, 2026, 10:25am UTC](https://discourse.paraview.org/t/outline-in-charts/17414/7 "2026-01-29T10:25:52Z")
Thanks!
BTW, for future reference and completeness of the workaround, you can hide the variable in the legend by using an empty label.
---
### Author:  [@mwestphal](https://discourse.paraview.org/u/mwestphal)
#### Post date: [January 29, 2026, 10:39am UTC](https://discourse.paraview.org/t/outline-in-charts/17414/8 "2026-01-29T10:39:22Z")
Nice find !