# Overlapping plots
**URL:** https://discourse.paraview.org/t/overlapping-plots/3030
**Category:** ParaView Support
**Tags:** python
**Created:** [November 22, 2019, 9:31pm UTC](https://discourse.paraview.org/t/overlapping-plots/3030 "2019-11-22T21:31:20Z")
**Posts on this page:** 7
**Page:** 1
### Author:  [@henry2004y](https://discourse.paraview.org/u/henry2004y)
#### Post date: [November 22, 2019, 9:31pm UTC](https://discourse.paraview.org/t/overlapping-plots/3030/1 "2019-11-22T21:31:20Z")
Hi,
I have a working script for generating plots for one file. Now I want to loop over all the files and generate one plot for each of them. Here is the script I am using:
```auto
from paraview.simple import *
#### disable automatic camera reset on 'Show'
paraview.simple._DisableFirstRenderCameraReset()
import glob
filenames = glob.glob("../data/*.vtu")
for filename in filenames:
# create a new 'XML Unstructured Grid Reader'
testvtu = XMLUnstructuredGridReader(
FileName=[filename])
testvtu.PointArrayStatus = ['B [nT]', 'P [nPa]']
# get active view
view = GetActiveViewOrCreate('RenderView')
# uncomment following to set a specific view size
view.ViewSize = [1352, 754]
# create a new 'Clip'
clip1 = Clip(Input=testvtu)
clip1.ClipType = 'Box'
clip1.ClipType.Position = [-2.0, -2.0, -2.0]
clip1.ClipType.Length = [2.0, 4.0, 4.0]
# create a new 'Contour'
contour1 = Contour(Input=clip1)
contour1.ContourBy = ['POINTS', 'B [nT]_Z']
contour1.Isosurfaces = [0.0]
# show data in view
contour1Display = Show(contour1, view)
# get color transfer function/color map for 'BnT_Z'
pnPaLUT = GetColorTransferFunction('P [nPa]')
# trace defaults for the display properties.
contour1Display.Representation = 'Surface'
contour1Display.ColorArrayName = ['POINTS', 'P [nPa]']
contour1Display.LookupTable = pnPaLUT
contour1Display.OSPRayScaleArray = 'P [nPa]'
contour1Display.OSPRayScaleFunction = 'PiecewiseFunction'
contour1Display.ScaleFactor = 0.4
contour1Display.SelectScaleArray = 'P [nPa]'
contour1Display.GlyphType = 'Arrow'
contour1Display.GlyphTableIndexArray = 'P [nPa]'
contour1Display.GaussianRadius = 0.02
contour1Display.SetScaleArray = ['POINTS', 'P [nPa]']
contour1Display.ScaleTransferFunction = 'PiecewiseFunction'
contour1Display.OpacityArray = ['POINTS', 'P [nPa]']
contour1Display.OpacityTransferFunction = 'PiecewiseFunction'
contour1Display.DataAxesGrid = 'GridAxesRepresentation'
contour1Display.PolarAxes = 'PolarAxesRepresentation'
# init the 'PiecewiseFunction' selected for 'ScaleTransferFunction'
contour1Display.ScaleTransferFunction.Points = [0.0, 0.0, 0.5, 0.0, 1.1757813367477812e-38, 1.0, 0.5, 0.0]
# init the 'PiecewiseFunction' selected for 'OpacityTransferFunction'
contour1Display.OpacityTransferFunction.Points = [0.0, 0.0, 0.5, 0.0, 1.1757813367477812e-38, 1.0, 0.5, 0.0]
# show color bar/color legend
contour1Display.SetScalarBarVisibility(view, True)
# rescale color and/or opacity maps used to include current data range
contour1Display.RescaleTransferFunctionToDataRange(True, False)
# show color bar/color legend
contour1Display.SetScalarBarVisibility(view, True)
# get color transfer function/color map for 'PnPa'
pnPaLUT = GetColorTransferFunction('PnPa')
# Properties modified on pnPaLUT
pnPaLUT.AutomaticRescaleRangeMode = 'Never'
# get opacity transfer function/opacity map for 'PnPa'
pnPaPWF = GetOpacityTransferFunction('PnPa')
# Rescale transfer function
pnPaLUT.RescaleTransferFunction(0.01, 10.0)
# Rescale transfer function
pnPaPWF.RescaleTransferFunction(0.01, 10.0)
# Apply a preset using its name.
pnPaLUT.ApplyPreset('Viridis (matplotlib)', True)
# get color legend/bar for pnPaLUT in view
pnPaLUTColorBar = GetScalarBar(pnPaLUT, view)
# change scalar bar placement
pnPaLUTColorBar.WindowLocation = 'AnyLocation'
pnPaLUTColorBar.Position = [0.83, 0.028]
pnPaLUTColorBar.ScalarBarLength = 0.33
# create a new 'Text'
text1 = Text()
tmin = int(filename[21:23])
tsec = int(filename[23:25])
time = tmin*60 + tsec
text1.Text = 't = ' + str(time) + 's'
#text1.Text = filename
text1Display = Show(text1, view)
text1Display.WindowLocation = 'UpperLeftCorner'
text1Display.FontFamily = 'Courier'
text1Display.FontSize = 10
# current camera placement for view
view.CameraPosition = [-6.399978992012728, -0.7675947684358911, 0.007641971283834748]
view.CameraFocalPoint = [3.220738468431737, 0.07902926244000752, 0.007641971283834748]
view.CameraViewUp = [0.0, 0.0, 1.0]
view.CameraParallelScale = 1.384939947024134
# save screenshot
SaveScreenshot(
filename[0:-3]+'png',
view, ImageResolution=[1352, 754])
ResetSession()
```
However, this gave me some overlapped figures like:
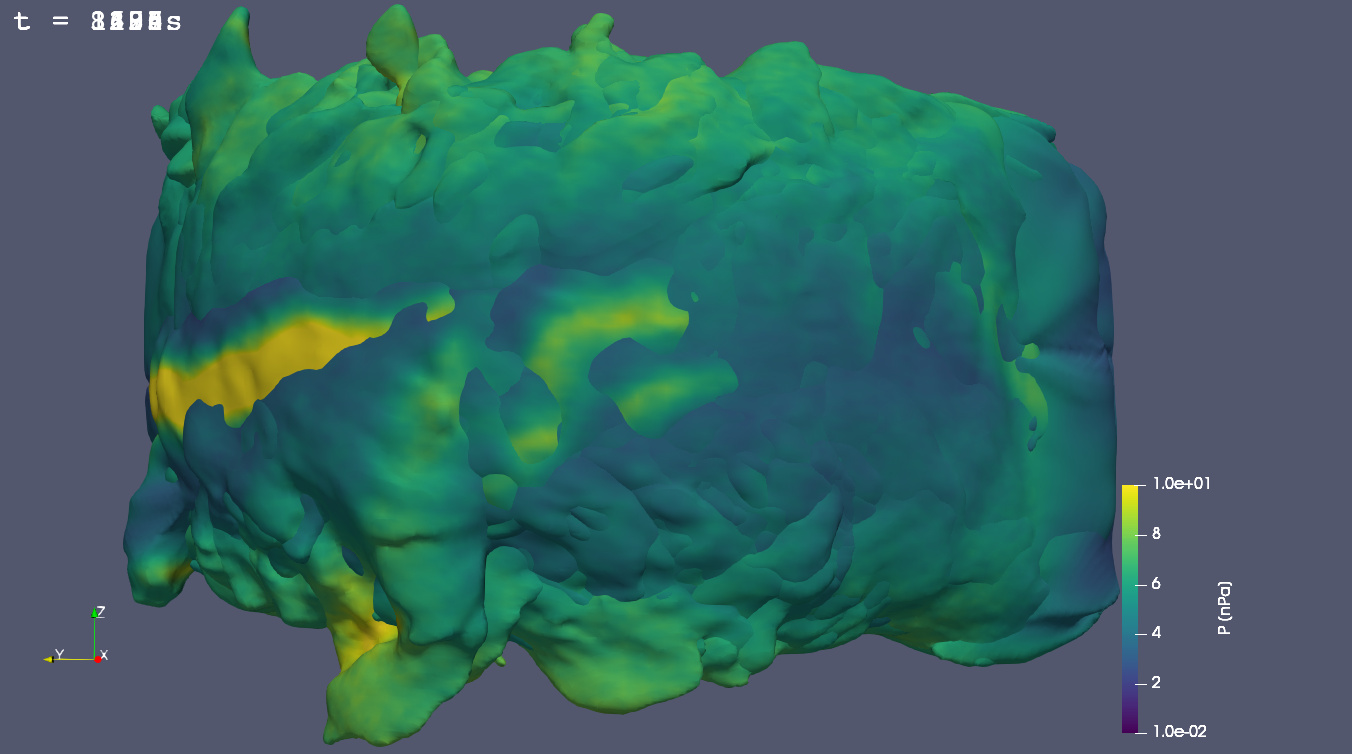 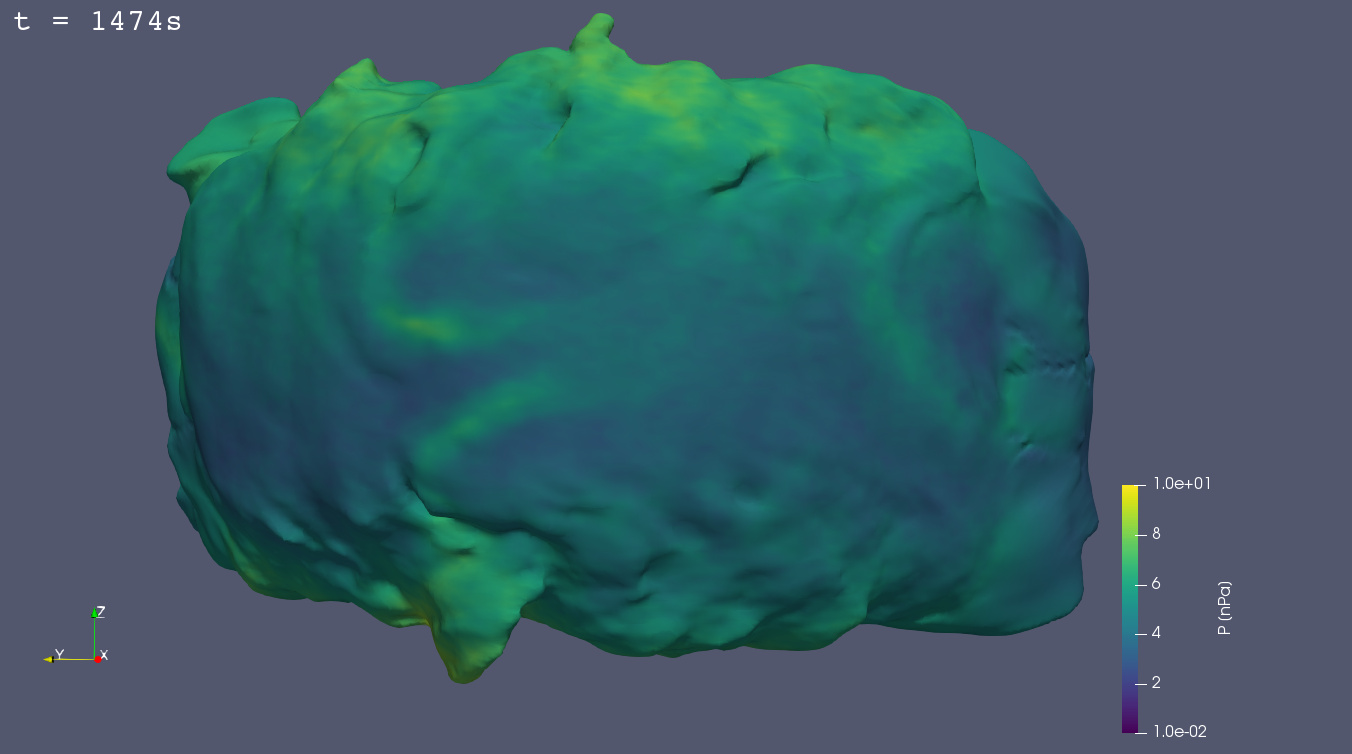
I thought ResetSession() might resolve the problem, but it didn’t. So what am I missing here? Should I avoid creating new Text() and Contour(), and reuse the old ones?
Thanks!
---
### Author:  [@mwestphal](https://discourse.paraview.org/u/mwestphal)
#### Post date: [November 25, 2019, 3:42pm UTC](https://discourse.paraview.org/t/overlapping-plots/3030/2 "2019-11-25T15:42:02Z")
Sorry, it is quite unclear how this could happen.
Could you share data and steps to reproduce ?
---
### Author:  [@Kenneth\_Moreland](https://discourse.paraview.org/u/Kenneth_Moreland)
#### Post date: [November 25, 2019, 3:58pm UTC](https://discourse.paraview.org/t/overlapping-plots/3030/3 "2019-11-25T15:58:19Z")
It’s weird that `ResetSession` is not deleting the object. I suspect it is because in order to do a `ResetSession` the Python interpreter has to disconnect from the ParaView service instance and connect to a new one. Perhaps there is something about a non-interactive loop that is delaying the shutdown and restart of the ParaView service.
Anyway, a way around the problem should be to use the `Delete` function to delete each of the objects that you create. It’s probably best to delete them in the reverse order that they were created. So something like this at the end of your loop.
```python
Delete(text1)
Delete(contour1)
Delete(clip1)
Delete(testvtu)
```
One more thing although you didn’t ask. You might consider doing the contour first and the clip second. The operation should be more efficient that way.
---
### Author:  [@henry2004y](https://discourse.paraview.org/u/henry2004y)
#### Post date: [November 25, 2019, 5:13pm UTC](https://discourse.paraview.org/t/overlapping-plots/3030/4 "2019-11-25T17:13:12Z")
> [@Kenneth\_Moreland](#):
>
> Delete(contour1) Delete(clip1) Delete(testvtu)
Yeah I think this is kind of a bug, and your solution works for me on my Mac, but not on the Linux server. For some unknown reason, it crashed after I first did the contour and then did the clip. At the line of `contour1Display = Show(contour1, view)`, it said:
```auto
ERROR: In /admin/build/admin/rpms/frontera/BUILD/ParaView-v5.6.0/VTK/Common/Core/vtkGenericDataArray.txx, line 452
vtkIdTypeArray (0x96eb770): Unable to allocate 241094125 elements of size 8 bytes.
terminate called after throwing an instance of 'std::bad_alloc'
what(): std::bad_alloc
./run_pvbatch_login: line 2: 74488 Aborted
```
BTW, if I run this script in the GUI python shell, it does not do anything. I don’t know what’s going on there.
---
### Author:  [@henry2004y](https://discourse.paraview.org/u/henry2004y)
#### Post date: [November 25, 2019, 5:48pm UTC](https://discourse.paraview.org/t/overlapping-plots/3030/5 "2019-11-25T17:48:11Z")
Here are two sample outputs. Link: [https://drive.google.com/file/d/1nP2WmMKzavK3n8EKHQh\_V2iR3QG72SbD/view?usp=sharing](https://drive.google.com/file/d/1nP2WmMKzavK3n8EKHQh_V2iR3QG72SbD/view?usp=sharing)
[https://drive.google.com/file/d/1-0iJyK6AOIRooZifmvgqo-B5bGzMDTGk/view?usp=sharing](https://drive.google.com/file/d/1-0iJyK6AOIRooZifmvgqo-B5bGzMDTGk/view?usp=sharing)
Probably you need to modify some directory in the script. I would say it is very obvious with the Text() object. Even without the data, you may be able to reproduce the issue.
---
### Author:  [@insley](https://discourse.paraview.org/u/insley)
#### Post date: [March 11, 2020, 7:06pm UTC](https://discourse.paraview.org/t/overlapping-plots/3030/6 "2020-03-11T19:06:30Z")
Apologies for the very late reply to this thread. I just ran across it while searching for the answer to a completely different question. I’m not sure what is causing this error, but I routinely do something very similar to this, so thought I’d share the method that works for me.
After setting up my pipeline in the GUI, I save the state as a python script, then edit it to look something like the following:
```
import sys
DEST_IMAGE_DIR="/path_to_output_image_directory"
DATA_DIR= "/path_to_input_data"
DATA_FILES = []
total_steps = 300
for i in range(0, total_steps):
temp_name = "%s/data_step_%04d.vtu" % (DATA_DIR, i)
DATA_FILES.append(temp_name)
start_frame=int(sys.argv[1])
num_frames=int(sys.argv[2])
renderView1 = CreateView('RenderView')
## set other view parameters
ugrid_data = XMLUnstructuredGridReader(FileName= DATA_FILES[start_frame])
## Set up all of your filters and rendering parameters
## Now loop over the given set of frames, and write out an image for each
for i in range(start_frame, start_frame+num_frames):
ugrid_data.FileName=DATA_FILES[i]
IMAGE_FILE_NAME="%s/frame_%04d.png" % (DEST_IMAGE_DIR, i)
print ("Save: ", IMAGE_FILE_NAME)
WriteImage(IMAGE_FILE_NAME)
```
Then, I typically run pvbatch on a cluster, and can submit multiple jobs to work on multiple chunks of frames in parallel:
```
pvbatch script.py 0 100
pvbatch script.py 100 100
pvbatch script.py 200 100
```
Hopefully folks find this useful.
Cheers,
joe
---
### Author:  [@henry2004y](https://discourse.paraview.org/u/henry2004y)
#### Post date: [March 11, 2020, 7:17pm UTC](https://discourse.paraview.org/t/overlapping-plots/3030/7 "2020-03-11T19:17:59Z")
Thanks for sharing this!
My original feeling was that this might have something to do with Garbage Collection (GC) in Python. I have never encountered such behaviour in C or Fortran. I may be wrong, though.