# Paraview 5.10 plot x,y,z and Temperature
**URL:** https://discourse.paraview.org/t/paraview-5-10-plot-x-y-z-and-temperature/8744
**Category:** ParaView Support
**Created:** [January 7, 2022, 4:27am UTC](https://discourse.paraview.org/t/paraview-5-10-plot-x-y-z-and-temperature/8744 "2022-01-07T04:27:04Z")
**Posts on this page:** 8
**Page:** 1
### Author:  [@yue2021](https://discourse.paraview.org/u/yue2021)
#### Post date: [January 7, 2022, 4:27am UTC](https://discourse.paraview.org/t/paraview-5-10-plot-x-y-z-and-temperature/8744/1 "2022-01-07T04:27:04Z")
Dear all,
I want to plot data of 3D temperature field (four columns: x y z Temp), and I followed these steps,
> import csv file
> filter to Table to Points apply
> set field 0 1 2 to x y z apply
> filter to Delaunay 3D
but errors out in the third step
ERROR: In C:\glr\builds\paraview\paraview-ci\build\superbuild\paraview\src\VTK\Filters\General\vtkTableToPolyData.cxx, line 103
vtkTableToPolyData (00000224B88F29A0): Failed to locate the columns to use for the point coordinates
ERROR: In C:\glr\builds\paraview\paraview-ci\build\superbuild\paraview\src\VTK\Common\ExecutionModel\vtkExecutive.cxx, line 753
vtkPVCompositeDataPipeline (00000224BB1C9DB0): Algorithm vtkTableToPolyData(00000224B88F29A0) returned failure for request: vtkInformation (00000224BBC88C20)
Debug: Off
Modified Time: 3162636
Reference Count: 1
Registered Events: (none)
Request: REQUEST\_DATA
FORWARD\_DIRECTION: 0
ALGORITHM\_AFTER\_FORWARD: 1
FROM\_OUTPUT\_PORT: 0
[T1.csv](https://discourse.paraview.org/uploads/short-url/oaBC3T4gBBhVmPB2t9ZG04G5Ayh.csv) (376.9 KB)
[T-surf.csv](https://discourse.paraview.org/uploads/short-url/9uEPdf3SpmlH6uDo98HN2daaS0P.csv) (473.4 KB)
I am new to Paraview, really appreciate you can help!
Thank you so much.
Best regards,
Yue
---
### Author:  [@Kenichiro-Yoshimi](https://discourse.paraview.org/u/Kenichiro-Yoshimi)
#### Post date: [January 7, 2022, 4:57am UTC](https://discourse.paraview.org/t/paraview-5-10-plot-x-y-z-and-temperature/8744/2 "2022-01-07T04:57:51Z")
Hi,
The following thread may be helpful in solving this.
> [@How to draw x, y, Z, vector point data in paraview](https://discourse.paraview.org/t/how-to-draw-x-y-z-vector-point-data-in-paraview/5962):
>
> Hello, engineer I have some important questions to ask you! After importing the data by using the CSV file, there is a problem in the calculation of tabletopoints1 module, and the next calculation cannot be carried out. Attached is my CSV file[S2T0.csv](https://discourse.paraview.org/uploads/short-url/AuFFlkej42dxTle9ecXhvwnxZ1A.csv) (17.6 KB) After using the calculator1 module for data processing, there is no result, and then the results cannot be used for coloring and subsequent processing. For the same operation, the subsequent processing can be carried out wi…
---
### Author:  [@todoooo](https://discourse.paraview.org/u/todoooo)
#### Post date: [January 7, 2022, 5:38am UTC](https://discourse.paraview.org/t/paraview-5-10-plot-x-y-z-and-temperature/8744/3 "2022-01-07T05:38:42Z")
In Windows 10 you can remove the BOM with _Notepad_
---
### Author:  [@yue2021](https://discourse.paraview.org/u/yue2021)
#### Post date: [January 7, 2022, 4:02pm UTC](https://discourse.paraview.org/t/paraview-5-10-plot-x-y-z-and-temperature/8744/4 "2022-01-07T16:02:42Z")
Hi Yoshimi,
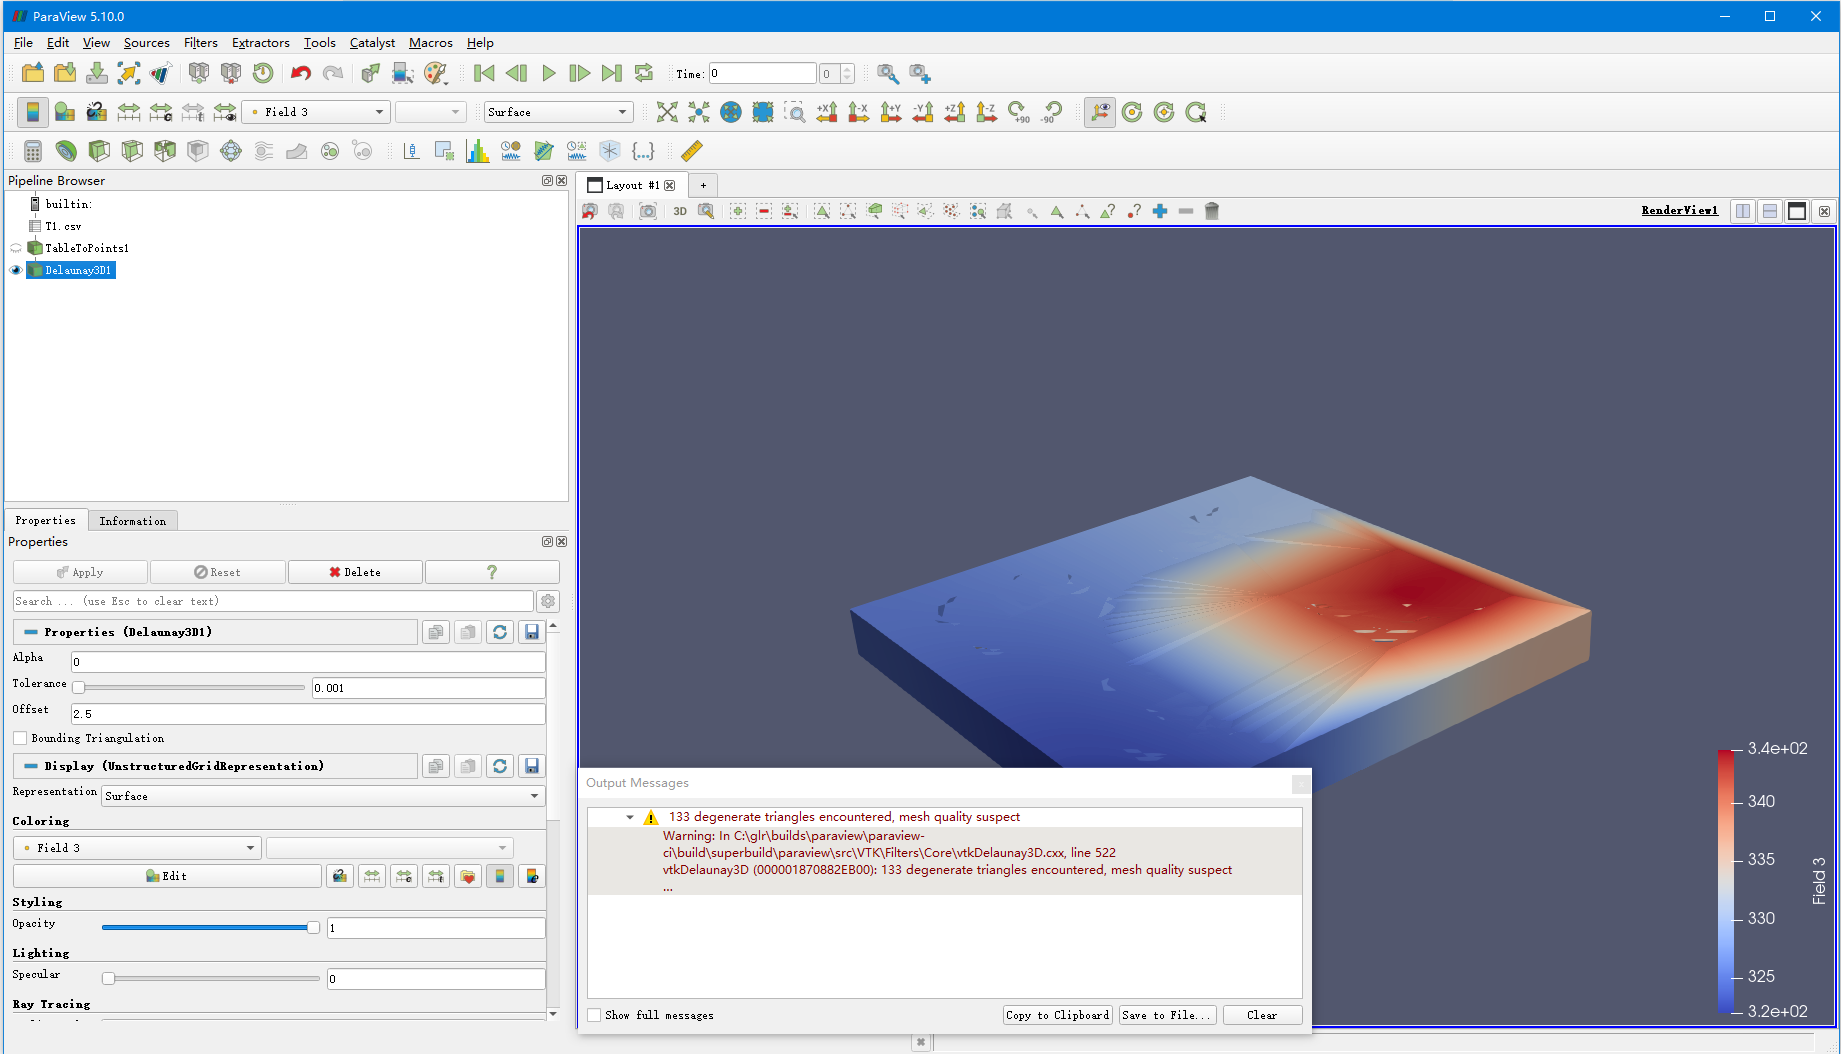
Thank you so much and sorry for disturbing you again. For the second step TabletoPoints, it does work well now! However, a new problem occurs. When it comes to the third step Delaunay3D, there may be something wrong with the mesh. The temperature distribution is nearly what I want.
So, how can I fix this, please? Thank you so much.
Warning: In C:\glr\builds\paraview\paraview-ci\build\superbuild\paraview\src\VTK\Filters\Core\vtkDelaunay3D.cxx, line 522
vtkDelaunay3D (000001870882EB00): 133 degenerate triangles encountered, mesh quality suspect
Best regards,
Yue
---
### Author:  [@yue2021](https://discourse.paraview.org/u/yue2021)
#### Post date: [January 7, 2022, 4:04pm UTC](https://discourse.paraview.org/t/paraview-5-10-plot-x-y-z-and-temperature/8744/5 "2022-01-07T16:04:30Z")
Dear Todd,
Thank you so much. That helps me! But new problem out, could you please give some adives?
Regards,
Yue
---
### Author:  [@Kenichiro-Yoshimi](https://discourse.paraview.org/u/Kenichiro-Yoshimi)
#### Post date: [January 8, 2022, 5:00am UTC](https://discourse.paraview.org/t/paraview-5-10-plot-x-y-z-and-temperature/8744/7 "2022-01-08T05:00:18Z")
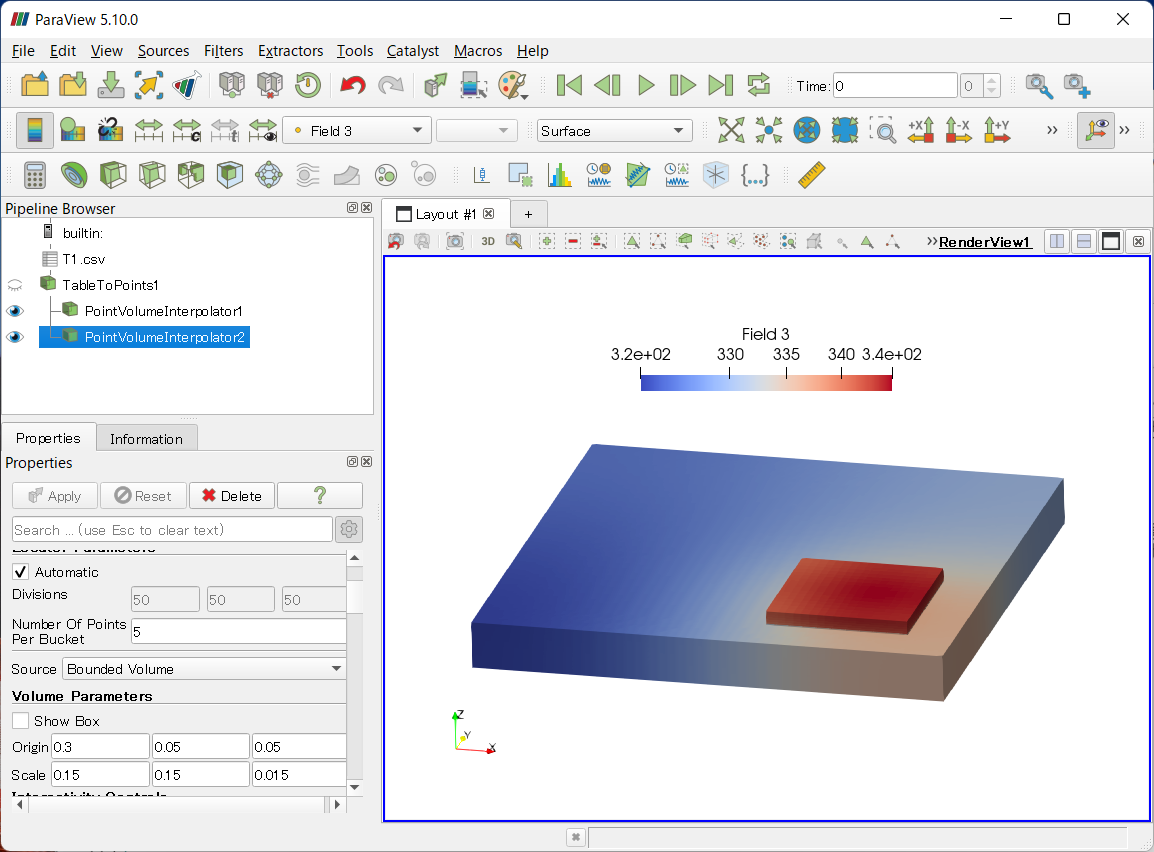
The **Delaunay3D** filter produces a convex hull. Therefore, it may not be appropriate for non-convex shapes like this one. For this reason, you may need to try another method. For example, since the current shape is a simple shape consisting of two bricks, top and bottom, it may be better to apply the **Point Volumme Interpolator** to each of them.
Below is the State file and the resulting image.
[2\_interpolators.pvsm](https://discourse.paraview.org/uploads/short-url/5BpnFX7IS7tZDRpILoXk1OdLiVj.pvsm) (474.3 KB)
---
### Author:  [@yue2021](https://discourse.paraview.org/u/yue2021)
#### Post date: [January 9, 2022, 6:05am UTC](https://discourse.paraview.org/t/paraview-5-10-plot-x-y-z-and-temperature/8744/8 "2022-01-09T06:05:57Z")
Wow, that’s cool.
Thank you so much for the detailed information and it does help, Yoshimi.
Best regards,
Yue
---
### Author:  [@todoooo](https://discourse.paraview.org/u/todoooo)
#### Post date: [January 10, 2022, 8:23am UTC](https://discourse.paraview.org/t/paraview-5-10-plot-x-y-z-and-temperature/8744/9 "2022-01-10T08:23:43Z")
The problem comes from your data source where you have 144 coincident points in the CSV file. If you separate the temperature data for each brick volume into different files the Delaunay3D filter should work; however you then need to combine the output datasets into a single block in Paraview. Someone else can probably answer how difficult/easy that is.