# pflotran hd5 file
**URL:** https://discourse.paraview.org/t/pflotran-hd5-file/5703
**Category:** ParaView Support
**Created:** [November 2, 2020, 5:07pm UTC](https://discourse.paraview.org/t/pflotran-hd5-file/5703 "2020-11-02T17:07:30Z")
**Posts on this page:** 8
**Page:** 1
### Author:  [@ValeRomano](https://discourse.paraview.org/u/ValeRomano)
#### Post date: [November 2, 2020, 5:07pm UTC](https://discourse.paraview.org/t/pflotran-hd5-file/5703/1 "2020-11-02T17:07:30Z")
Hi,
I have a dataset in hd5 format from my simulation with Pflotran.
I’d like to know if it is possible to extract the data as a function of time in a specific point of the model domain.
I saw that there is a filter to do this for other data formats.
Thank you,
Best
Valentina
---
### Author:  [@mwestphal](https://discourse.paraview.org/u/mwestphal)
#### Post date: [November 4, 2020, 8:33am UTC](https://discourse.paraview.org/t/pflotran-hd5-file/5703/2 "2020-11-04T08:33:53Z")
ForceTime filter ?
If you can read your data in ParaView, you can process it as any other format.
---
### Author:  [@ValeRomano](https://discourse.paraview.org/u/ValeRomano)
#### Post date: [November 4, 2020, 8:41am UTC](https://discourse.paraview.org/t/pflotran-hd5-file/5703/3 "2020-11-04T08:41:40Z")
Hi Mathieu,
yes I can definitely open the file, but I tried to use the same routine as in this tutorial, but I cannot get a result. Any suggestion?
## Plot point over time
- Edit → Reset Session.
- Open can.exo. Turn on all data. **Apply**.
- Drag the can around with the left mouse button until you can see the can.
- We want to plot a point over time. First, we need to select a point.
- Click on **Select Points On** icon. Then, click on a point on the can.
- **Filters→Data Analysis→Plot Point Over Time**. Apply.
- **Display** tab, unselect everything other than **DISPL (Magnitude)**
- You now have a plot of the displacement. at your point.
- Extra Credit – Using **Select Cells On** icon, and the **Plot Cell Over Time** , plot **EQPS** over time.
Thank you,
Valentina
---
### Author:  [@mwestphal](https://discourse.paraview.org/u/mwestphal)
#### Post date: [November 4, 2020, 2:22pm UTC](https://discourse.paraview.org/t/pflotran-hd5-file/5703/4 "2020-11-04T14:22:01Z")
Plot over time should work.
Could you share your data ?
---
### Author:  [@ValeRomano](https://discourse.paraview.org/u/ValeRomano)
#### Post date: [November 4, 2020, 4:34pm UTC](https://discourse.paraview.org/t/pflotran-hd5-file/5703/5 "2020-11-04T16:34:05Z")
Hi Mathew,
here is one of the files:
> **[valentina\_check.h5](https://drive.google.com/file/d/1_HQc3uLFRAH2Uy9Eyl_a1VXo42TTJ7fU/view?usp=sharing)**
>
> Google Drive file.
Thank you for your help,
Valentina
---
### Author:  [@mwestphal](https://discourse.paraview.org/u/mwestphal)
#### Post date: [November 6, 2020, 11:30am UTC](https://discourse.paraview.org/t/pflotran-hd5-file/5703/6 "2020-11-06T11:30:42Z")
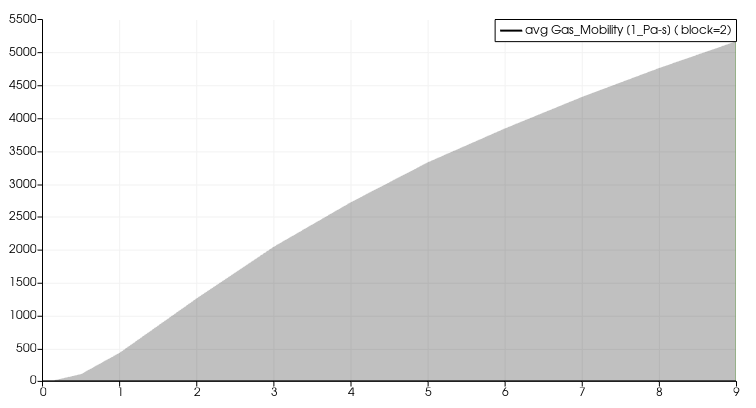
Plot data over time works with your dataset:
---
### Author:  [@ValeRomano](https://discourse.paraview.org/u/ValeRomano)
#### Post date: [November 6, 2020, 11:43am UTC](https://discourse.paraview.org/t/pflotran-hd5-file/5703/7 "2020-11-06T11:43:38Z")
Hi Mathieu,
Sounds great, how did you get that?
I couldn’t make it with that procedure
Thanks a lot,
Vale
Valentina Romano, PhD
Earth Sciences Department
Sapienza University of Rome
---
### Author:  [@mwestphal](https://discourse.paraview.org/u/mwestphal)
#### Post date: [November 16, 2020, 7:10pm UTC](https://discourse.paraview.org/t/pflotran-hd5-file/5703/8 "2020-11-16T19:10:47Z")
- Open your file with the PFOLTRAN reader
- Check all the cells data, Apply
- Add a plot data over time filterm Field association CELLS, Apply
- Create a QuartileChartView, show the plot over time filter in it