# Piping system stress plot
**URL:** https://discourse.paraview.org/t/piping-system-stress-plot/4531
**Category:** ParaView Support
**Created:** [June 7, 2020, 2:53pm UTC](https://discourse.paraview.org/t/piping-system-stress-plot/4531 "2020-06-07T14:53:29Z")
**Posts on this page:** 8
**Page:** 1
### Author:  [@PaintedBread](https://discourse.paraview.org/u/PaintedBread)
#### Post date: [June 7, 2020, 2:53pm UTC](https://discourse.paraview.org/t/piping-system-stress-plot/4531/1 "2020-06-07T14:53:29Z")
Hi to everyone,
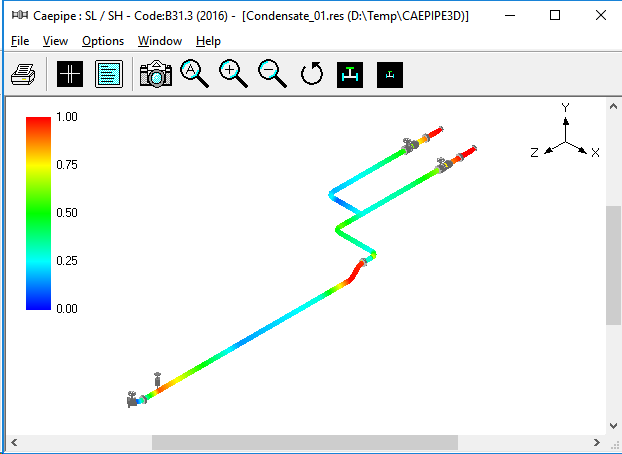
I’m wondering if it’s possible to create a plot similar to the attached one (piping system) with Paraview. I need to represent 3D pipe with colored map starting from nodal coordinates (X,Y,Z), pipe diameter (it could change along the pipe system) and stress/load values from my FEM results.
Thank you very much
---
### Author:  [@cory.quammen](https://discourse.paraview.org/u/cory.quammen)
#### Post date: [June 7, 2020, 10:09pm UTC](https://discourse.paraview.org/t/piping-system-stress-plot/4531/2 "2020-06-07T22:09:02Z")
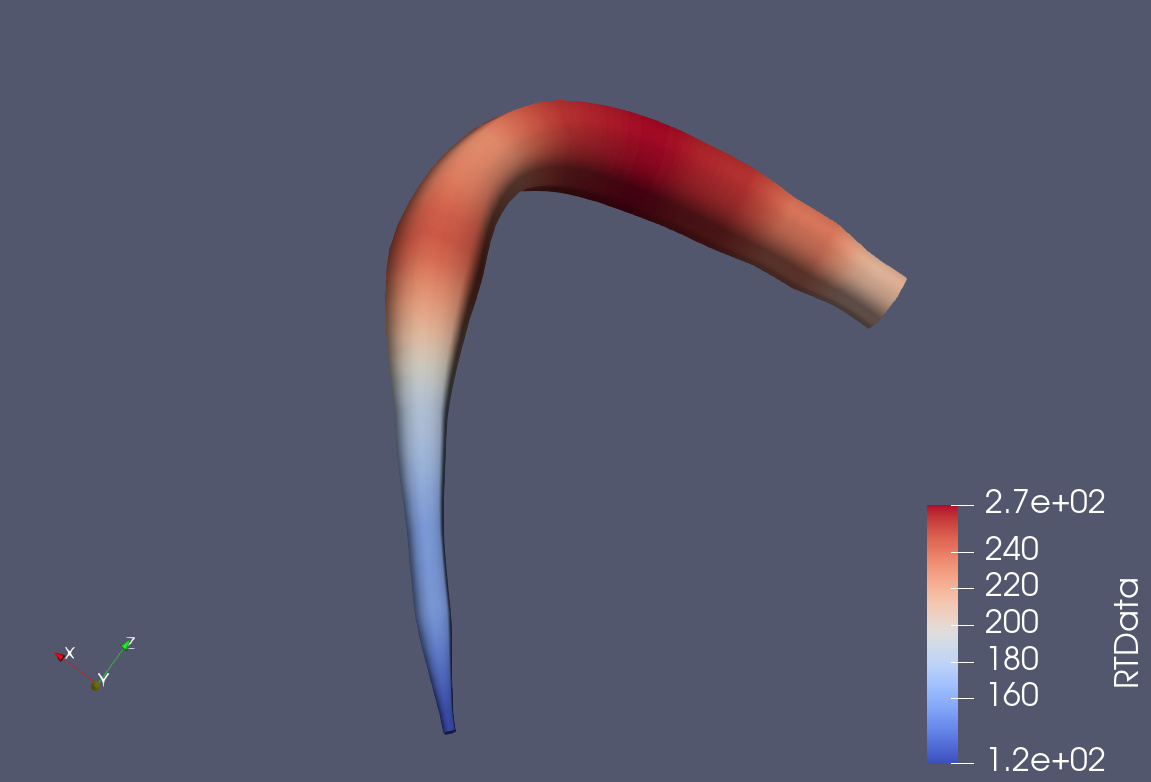
Welcome to ParaView, Painted Bread! Yes, it is possible using the **Tube** filter. The **Tube** filter can vary the radius according to a variable, and the resulting surface can be colored by that variable. Here’s a contrived example showing that.
---
### Author:  [@PaintedBread](https://discourse.paraview.org/u/PaintedBread)
#### Post date: [June 7, 2020, 10:54pm UTC](https://discourse.paraview.org/t/piping-system-stress-plot/4531/3 "2020-06-07T22:54:27Z")
Thank you Cory. Actually my aim is to represent results of the mechanical analysis (for example displacements) with colors and the diameter has to change only graphically. So I will have X, Y, Z coordinates of the tube axis polyline, diameter of tube at every node and numeric result of stress analysis. Is it possible to do this with tubefilter? Thank you very much
---
### Author:  [@R\_C](https://discourse.paraview.org/u/R_C)
#### Post date: [February 27, 2021, 3:34pm UTC](https://discourse.paraview.org/t/piping-system-stress-plot/4531/4 "2021-02-27T15:34:52Z")
Hi Cory,
I don’t seem to find the solution to actually do this.
I can’t find the way to indicate a variable diameter (or any other property) when creating the Tube filter.
With python I can assign Scalars or Vectors to a Tube filter instance but there’s no explanation in the help as to which format this should be in (a simple array is not working)
---
### Author:  [@cory.quammen](https://discourse.paraview.org/u/cory.quammen)
#### Post date: [March 1, 2021, 8:49pm UTC](https://discourse.paraview.org/t/piping-system-stress-plot/4531/5 "2021-03-01T20:49:42Z")
Hi @R_C ,
The way to vary diameter is indeed by setting either the Scalars array (if your data has a single scalar value) or Vectors (if your data has multiple components). You will also need to set the “Vary Radius” property to “By Scalar” if you want to scale the diameter by the selected Scalars array or “By Vector” if you want to do that with the selected Vectors array. There are some other variants as well.
If that doesn’t solve the problem, please detail what you have tried so we can see how to help.
---
### Author:  [@R\_C](https://discourse.paraview.org/u/R_C)
#### Post date: [March 8, 2021, 3:19pm UTC](https://discourse.paraview.org/t/piping-system-stress-plot/4531/6 "2021-03-08T15:19:01Z")
Hi @cory.quammen ,
Thanks for your reply.
I’ve seen examples doing this working directly with vtkPolyData() and adding a scalar as a vtkDoubleArray().
I was just wondering if it was possible to do the same using only paraview.simple.
Here’s my code so far which I run from Spyder
import paraview.simple as pvs
import pandas as pd
#Define some data
coords\_lst = [[0,0,0,10,50],[10,15,50,20,40],[20,20,60,30,30],
[20,30,40,40,20],[40,40,60,50,10]]
coords\_df = pd.DataFrame(coords\_lst, columns=[‘x’,‘y’,‘z’,‘prop1’,‘prop2’])
#Create a PolyLineSource
pl = pvs.PolyLineSource(Points=coords\_df.values.flatten(),
registrationName=‘a\_polyline’)
#Create a scalar using the calculator filter
calculator = pvs.Calculator(registrationName=‘calc’, Input=pl)
calculator.ResultArrayName = ‘radius’
calculator.Function = ‘coordsX’
#create a Tube filter with radius and color? by scalar
tube = pvs.Tube(registrationName=‘tube’, Input=calculator)
tube.Scalars = [‘POINTS’, ‘radius’]
tube.Radius = 0.5
tube.VaryRadius = ‘By Scalar’
pvs.Show()
pvs.Render()
This works pretty well and I get a tube changing its radius and color.
Now, as you can see I have other properties in my Pandas DataFrame. I would like to use those properties to vary the radius but I cannot seem to find a solution from paraview.simple
Thanks in advance
---
### Author:  [@R\_C](https://discourse.paraview.org/u/R_C)
#### Post date: [March 26, 2021, 12:30pm UTC](https://discourse.paraview.org/t/piping-system-stress-plot/4531/7 "2021-03-26T12:30:37Z")
I was probably barking at the wrong tree.
Pyvista seems to be better adapted to what I want
[https://github.com/pyvista/pyvista](https://github.com/pyvista/pyvista)
---
### Author:  [@cory.quammen](https://discourse.paraview.org/u/cory.quammen)
#### Post date: [March 26, 2021, 1:37pm UTC](https://discourse.paraview.org/t/piping-system-stress-plot/4531/8 "2021-03-26T13:37:51Z")
Sorry I didn’t quite understand what you were looking for - now I understand. PyVista will likely make it easier for you to add selected data from a data frame. In ParaView, you could use a **Programmable Source** to create the `vtkPolyData` from points and add the arrays. An example script:
```python
import numpy as np
pts = np.random.rand(2,3)
# Add points
output.Points = pts
# Add cells
output.VTKObject.Allocate()
output.VTKObject.InsertNextCell(vtk.VTK_POLY_LINE, pts.shape[0], range(pts.shape[0]))
# Add point data
output.PointData.append(np.random.rand(2), 'ArrayName')
```
In this example, I’ve used numpy arrays that I assume you can replace with data frame arrays (sorry, I don’t have experience with pandas).