# Plot a simple XY chart
**URL:** https://discourse.paraview.org/t/plot-a-simple-xy-chart/1177
**Category:** ParaView Support
**Created:** [January 24, 2019, 5:33pm UTC](https://discourse.paraview.org/t/plot-a-simple-xy-chart/1177 "2019-01-24T17:33:18Z")
**Posts on this page:** 6
**Page:** 1
### Author:  [@ashahba](https://discourse.paraview.org/u/ashahba)
#### Post date: [January 24, 2019, 5:33pm UTC](https://discourse.paraview.org/t/plot-a-simple-xy-chart/1177/1 "2019-01-24T17:33:19Z")
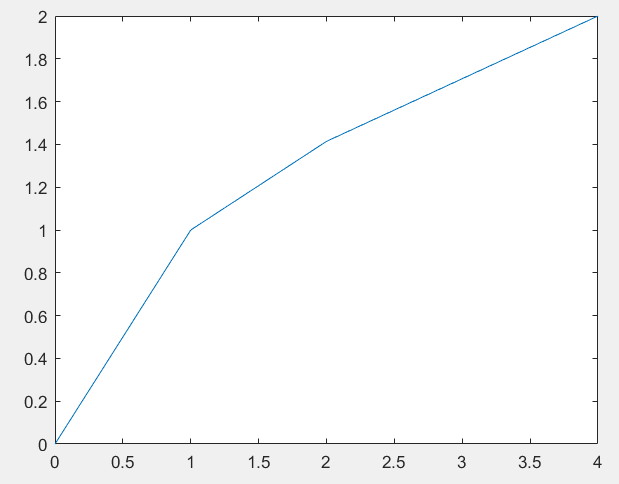
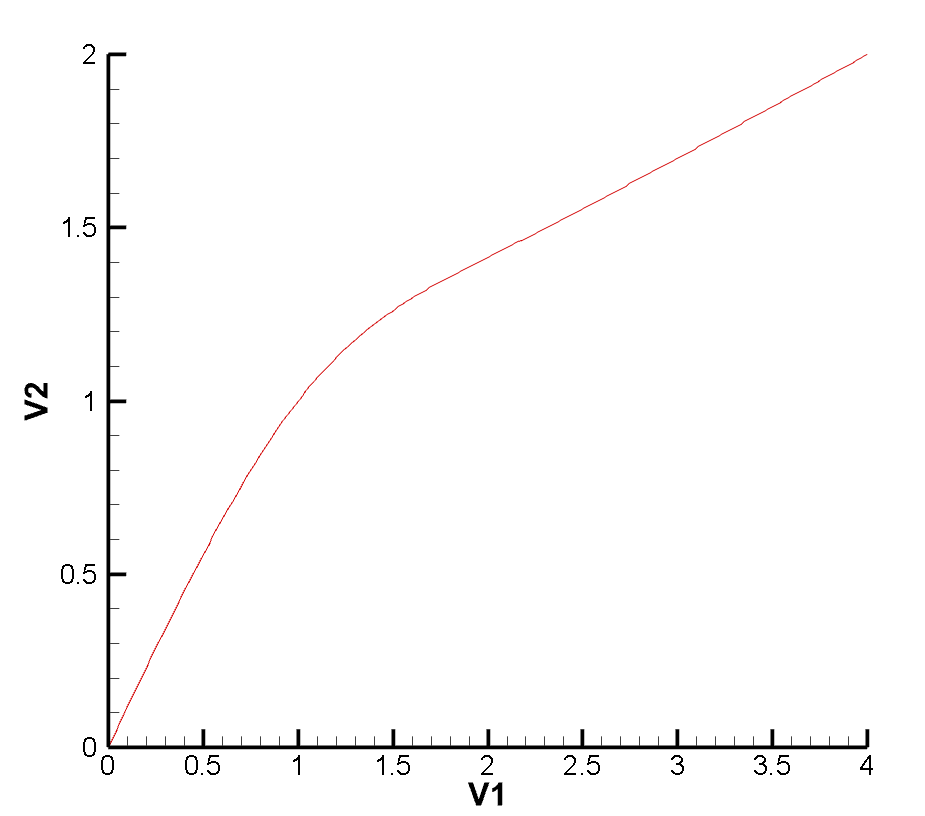
I want to draw a simple line chart with Paraview. It is a simple XY plot. My input data is something like
X Y
0 0
1 1
2 1.4142
4 2
I would like to store this data in a file with a format that paraview can read and generate a simple plot like this.
I would like to know what the file type and required format should be. Any help would be appreciated
---
### Author:  [@mwestphal](https://discourse.paraview.org/u/mwestphal)
#### Post date: [January 25, 2019, 8:47am UTC](https://discourse.paraview.org/t/plot-a-simple-xy-chart/1177/2 "2019-01-25T08:47:45Z")
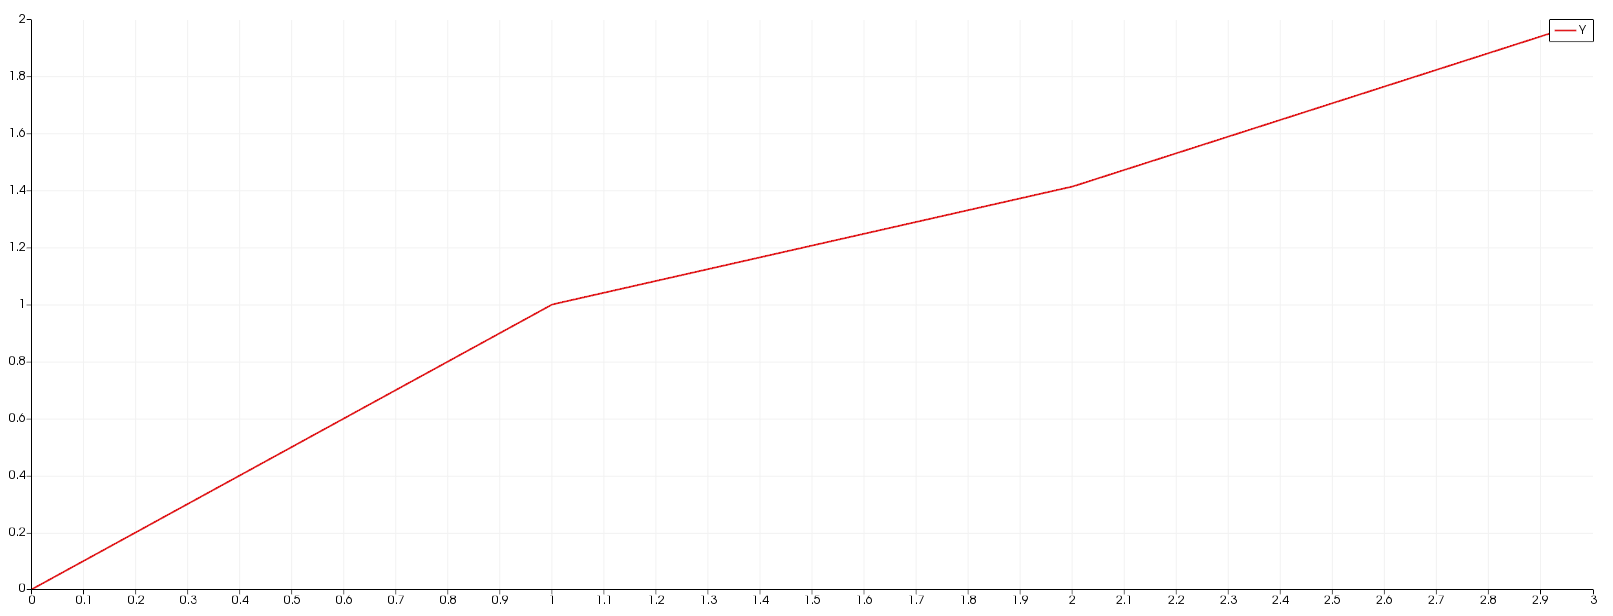
The simple way to go is with a [csv](https://discourse.paraview.org/uploads/default/original/2X/3/34990586d092e5b2121f1ac1e22ba800e49b1e88.csv) file.
- Open ParaView
- Open your csv file
- Set separator to " "
- Apply
- Create a new view, Line Chart View
- Show your file in the view
- In Series Parameters, check “Y”
---
### Author:  [@ashahba](https://discourse.paraview.org/u/ashahba)
#### Post date: [January 25, 2019, 11:58am UTC](https://discourse.paraview.org/t/plot-a-simple-xy-chart/1177/3 "2019-01-25T11:58:59Z")
Thanks a lot! It worked out!
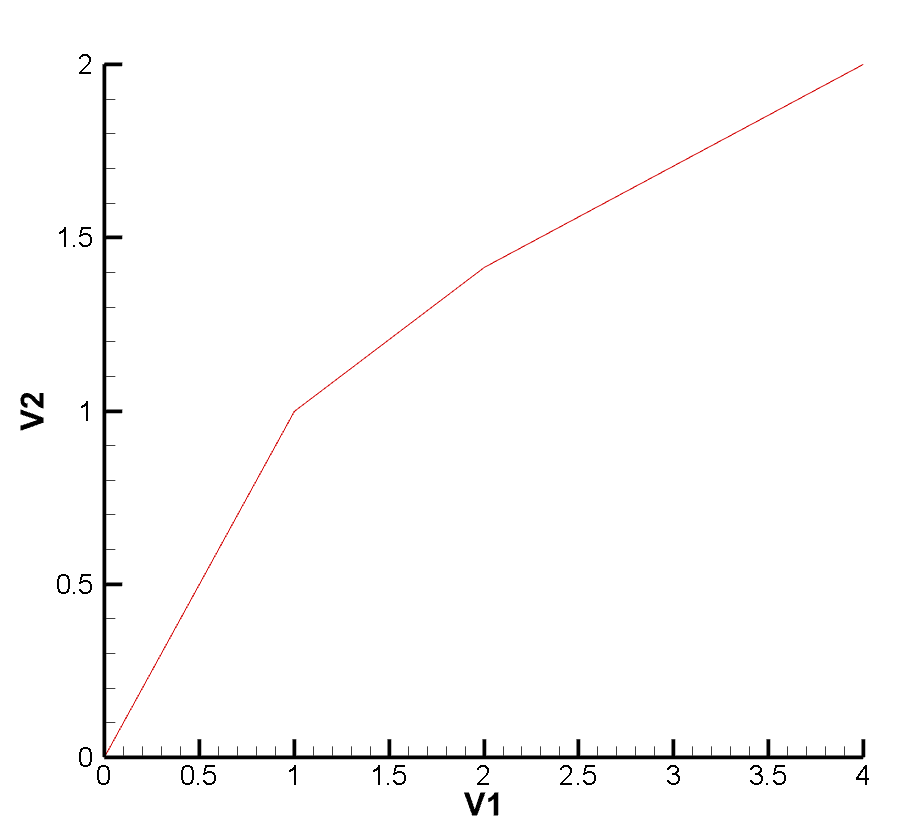
I am curious whether one can instruct Paraview to connect the discrete data points with line types other than a straight line. In Tecplot, for example, I can visualize this plot using different line styles
**line segment**
**Polynomial fit**
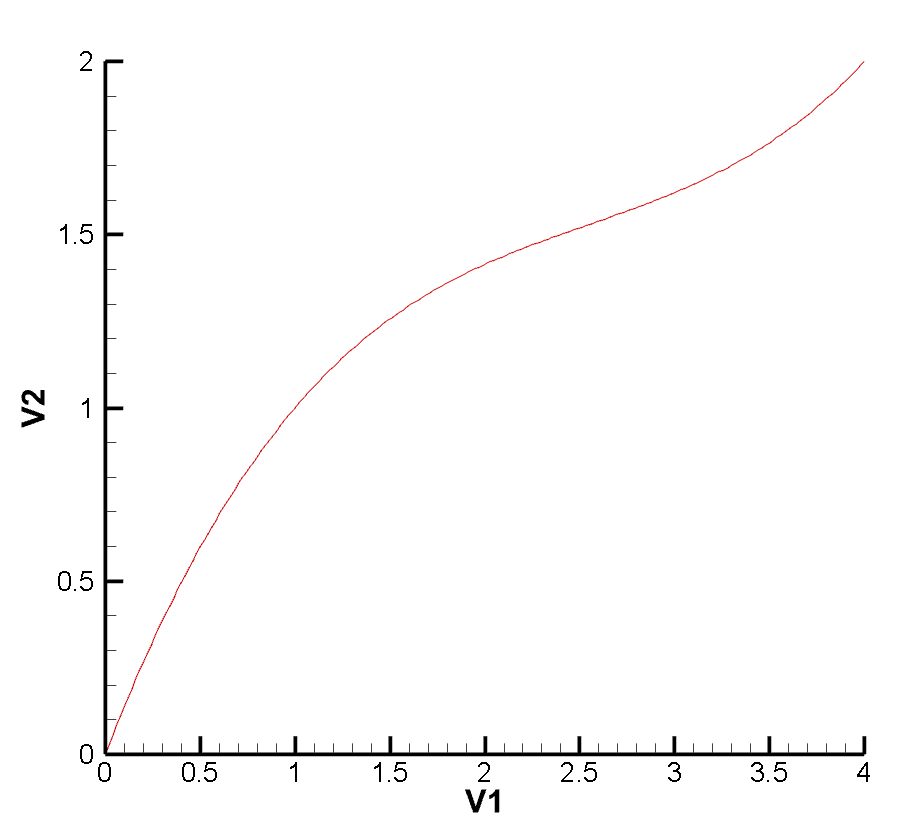
**Spline**
---
### Author:  [@cory.quammen](https://discourse.paraview.org/u/cory.quammen)
#### Post date: [January 25, 2019, 3:56pm UTC](https://discourse.paraview.org/t/plot-a-simple-xy-chart/1177/4 "2019-01-25T15:56:46Z")
Different interpolation methods for plots are not supported to my knowledge.
---
### Author:  [@henry\_zhang](https://discourse.paraview.org/u/henry_zhang)
#### Post date: [May 26, 2020, 6:39am UTC](https://discourse.paraview.org/t/plot-a-simple-xy-chart/1177/5 "2020-05-26T06:39:04Z")
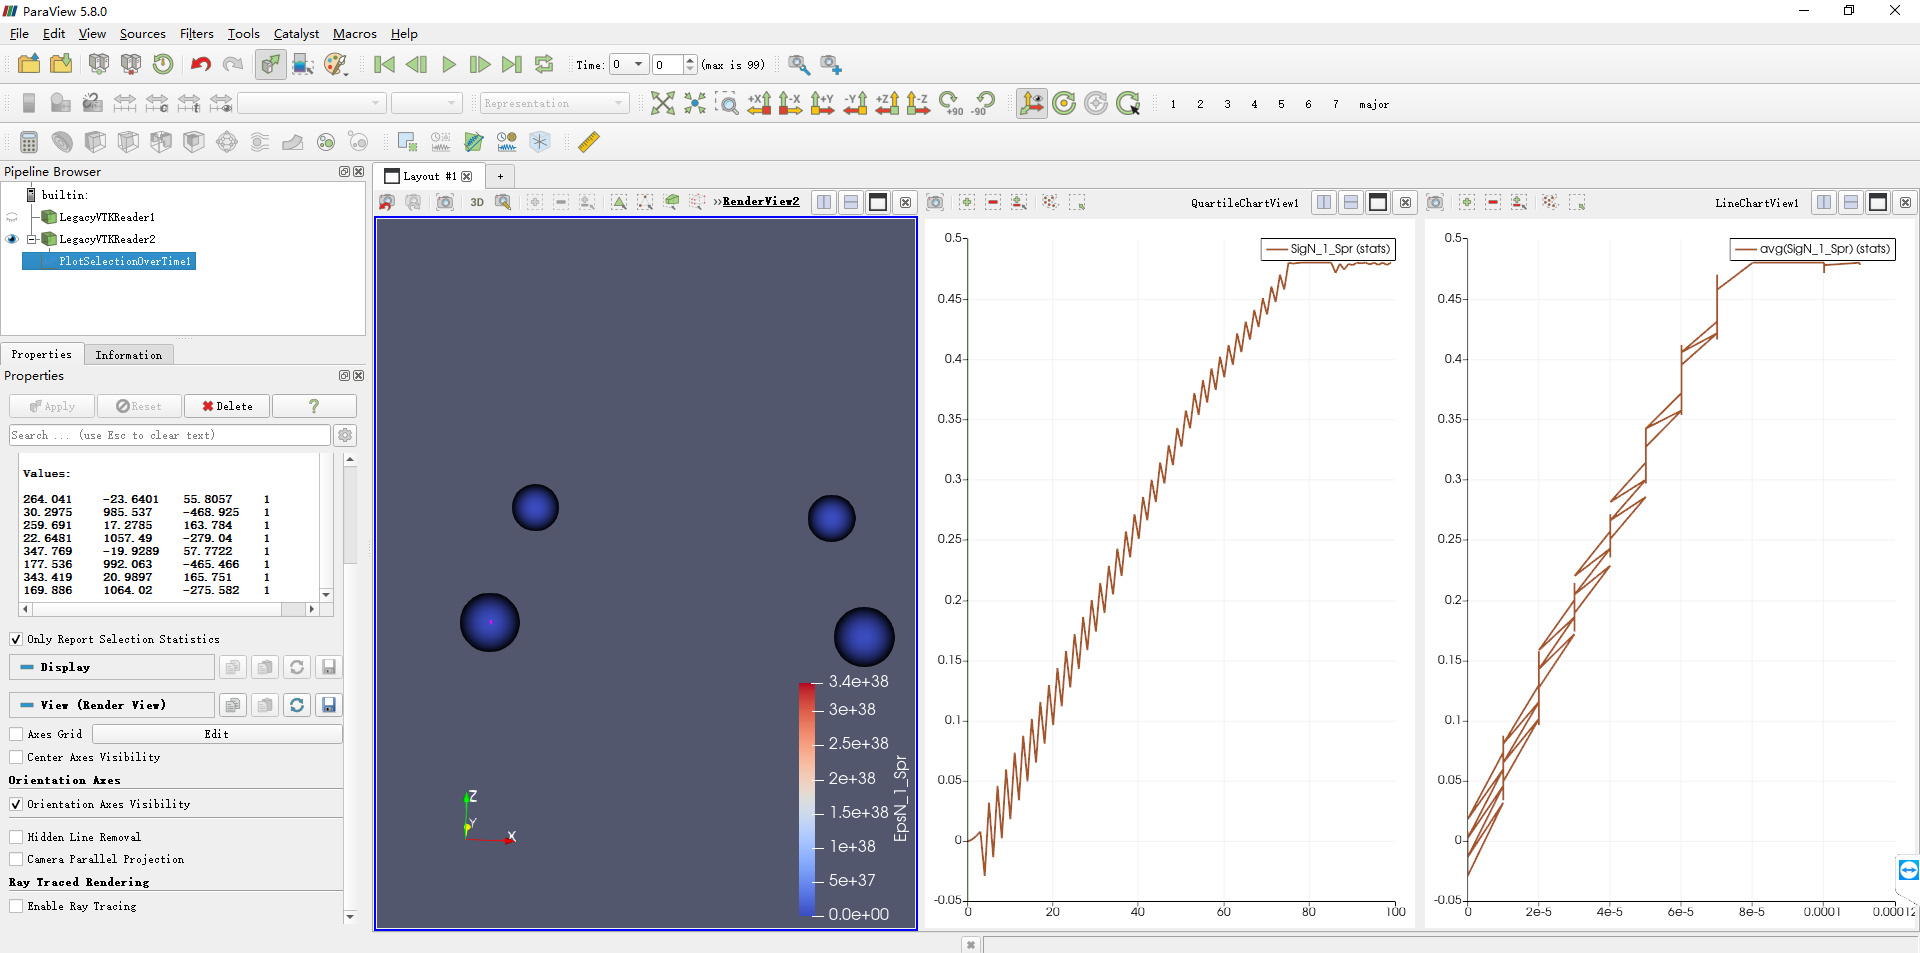
This question is close to my requirement. But I still have a question about how to draw a x-y curve with point data imported by vtk file. As shown below I can only draw time-y curve or x-y curve with avg/max/q3/std values at a frame. They are neither x-y curve with all frame data. I post the data file also.
Thanks if anyone can help!
[data.zip](https://discourse.paraview.org/uploads/short-url/2Sf0UxlCqGi7OLbtrwNZ1s9EZAs.zip) (4.8 KB)
---
### Author:  [@Kenneth\_Moreland](https://discourse.paraview.org/u/Kenneth_Moreland)
#### Post date: [May 26, 2020, 10:20pm UTC](https://discourse.paraview.org/t/plot-a-simple-xy-chart/1177/6 "2020-05-26T22:20:02Z")
Try unchecking `Only Report Selection Statistics`.