# Plot/Calculate along a Streamlines
**URL:** https://discourse.paraview.org/t/plot-calculate-along-a-streamlines/12405
**Category:** ParaView Support
**Created:** [June 28, 2023, 7:22am UTC](https://discourse.paraview.org/t/plot-calculate-along-a-streamlines/12405 "2023-06-28T07:22:10Z")
**Posts on this page:** 4
**Page:** 1
### Author:  [@Ruben](https://discourse.paraview.org/u/Ruben)
#### Post date: [June 28, 2023, 7:22am UTC](https://discourse.paraview.org/t/plot-calculate-along-a-streamlines/12405/1 "2023-06-28T07:22:10Z")
Dear Everybody,
my goal is to perform a calculation along a streamline:
I need to evaluate a certain integral along a streamline. The means following the streamline I would like to: Extract certain cell values, calculate a quotient of the variables, sum the calculated value for each individual cell over all cells that are crossed by the streamline. The final scalar value is the result that I am interested in.
I would appreciate any help or advice!!! What I need is a bit like plot along line and a python calculator combind. However, I would not even know what output type to specify, since the value of interest is a single scalar value…
So any help is appreciated a LOT. Some Ideas/Buzz words: extract cells along streamline as datasource, python calculator/programmable filter, output type, Integrate/sum, scalar value,
Many thanks to you all,
Ruben
P.S. I am dealing with an unstructured 2D grid. The cells are triangles of different size and shape.
---
### Author:  [@mwestphal](https://discourse.paraview.org/u/mwestphal)
#### Post date: [June 28, 2023, 7:29am UTC](https://discourse.paraview.org/t/plot-calculate-along-a-streamlines/12405/2 "2023-06-28T07:29:08Z")
Hi @Ruben
StreamTracer + PythonCalculator should do the trick.
---
### Author:  [@Ruben](https://discourse.paraview.org/u/Ruben)
#### Post date: [June 29, 2023, 2:45pm UTC](https://discourse.paraview.org/t/plot-calculate-along-a-streamlines/12405/3 "2023-06-29T14:45:33Z")
First thank you very much for your reply. But is there any way I could get some more information from you?
I have problems with the datatypes that are generated. Also I am not 100 percent sure, how to access the field data within the python calculater. Do you have a good resource for self study? Because the VTK documentation did not really help me a lot…
From what I understand, the output type of Stremtracer are polylines? When I extract the data generated by the streamtracer, I end up with the following information on the data.
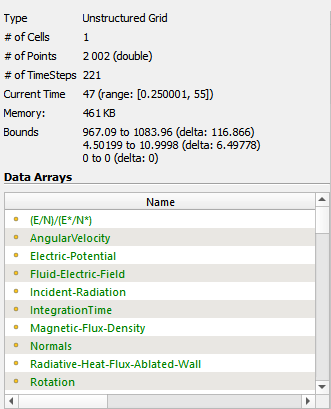
Sorry I am a bit lost…
My physical fields consist of cell data and point data. To calculate the final value, I will have to access both, cell and point data (Temperature and Pressure → Cell, Electric Field → Point). The streamline is a streamline of the electric field.
So I understand right that the general idea is: Generate input data for the python calculator with the help of the streamtracer feature?
Many thanks and excuse my confusing reply,
Ruben
---
### Author:  [@mwestphal](https://discourse.paraview.org/u/mwestphal)
#### Post date: [June 29, 2023, 2:53pm UTC](https://discourse.paraview.org/t/plot-calculate-along-a-streamlines/12405/4 "2023-06-29T14:53:50Z")
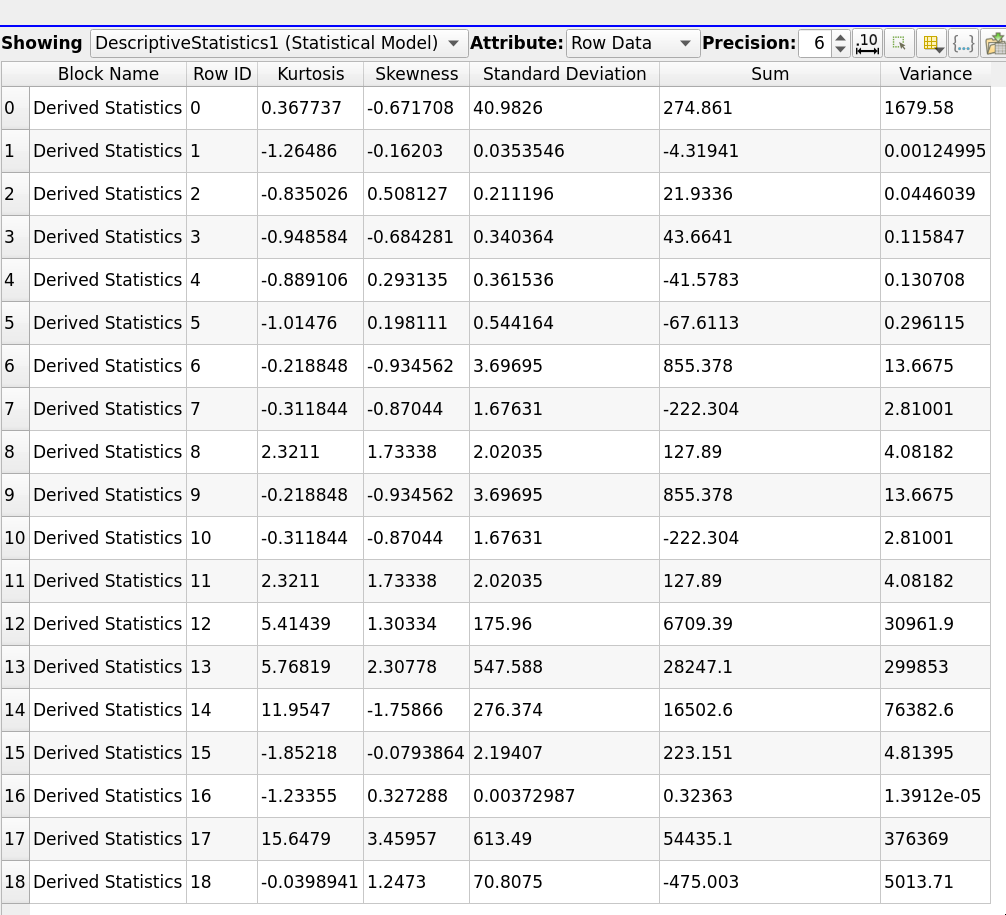
This output looks great ! You do not even need a PythonCalculator, the DescriptiveStatistics filter should do just what you need, you will find the sum in the DerivedStatistics block: