# Plot Data
**URL:** https://discourse.paraview.org/t/plot-data/8486
**Category:** ParaView Support
**Created:** [November 24, 2021, 9:35pm UTC](https://discourse.paraview.org/t/plot-data/8486 "2021-11-24T21:35:54Z")
**Posts on this page:** 5
**Page:** 1
### Author:  [@Pradip\_Aryal](https://discourse.paraview.org/u/Pradip_Aryal)
#### Post date: [November 24, 2021, 9:35pm UTC](https://discourse.paraview.org/t/plot-data/8486/1 "2021-11-24T21:35:54Z")
Hi Mathieau,
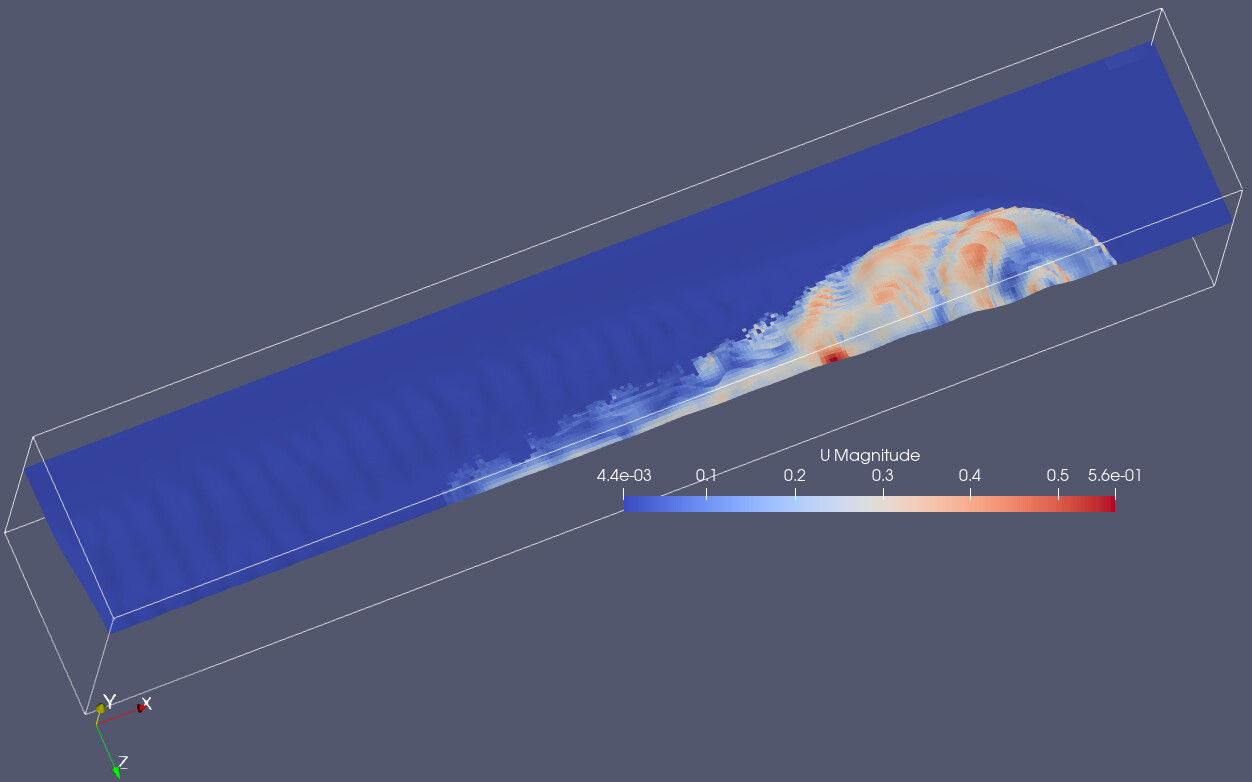
I have this kind of iso-surface (alpha = 0.5). Now I would like to plot Max(U(mag)) on that surface over time. Is it something we can do with Python ProgrammableFilter. Could you please give some hint.
(Solver: interfoam)
Best regards,
James
---
### Author:  [@mwestphal](https://discourse.paraview.org/u/mwestphal)
#### Post date: [November 25, 2021, 9:02am UTC](https://discourse.paraview.org/t/plot-data/8486/2 "2021-11-25T09:02:31Z")
please share your data
---
### Author:  [@Pradip\_Aryal](https://discourse.paraview.org/u/Pradip_Aryal)
#### Post date: [November 29, 2021, 4:30pm UTC](https://discourse.paraview.org/t/plot-data/8486/3 "2021-11-29T16:30:55Z")
Hi Mathieu,
I uploaded my data to the link below. I uploaded only about 6 time-steps to reduce the size of the file but in my original file, I have about 700 time steps.
So ideally, what I was looking forward to doing was to obtain the maximum velocity magnitude for each time-step at the isosurface of alpha.phase1 = 0.5.
Currently, I take a contour of alpha.phase1 with value 0.5 and visualize the velocity and see that maximum velocity. This is a very lengthy process and not possible to do for 700 time steps for several cases.
I would appreciate if there is a way around extracting it with ProgrammableFilter.
[https://drive.google.com/drive/folders/1x\_Qv-6KtDWudiv5XFy3\_nQhvDVYmjsef?usp=sharing](https://drive.google.com/drive/folders/1x_Qv-6KtDWudiv5XFy3_nQhvDVYmjsef?usp=sharing)
---
### Author:  [@mwestphal](https://discourse.paraview.org/u/mwestphal)
#### Post date: [November 30, 2021, 10:25am UTC](https://discourse.paraview.org/t/plot-data/8486/4 "2021-11-30T10:25:04Z")
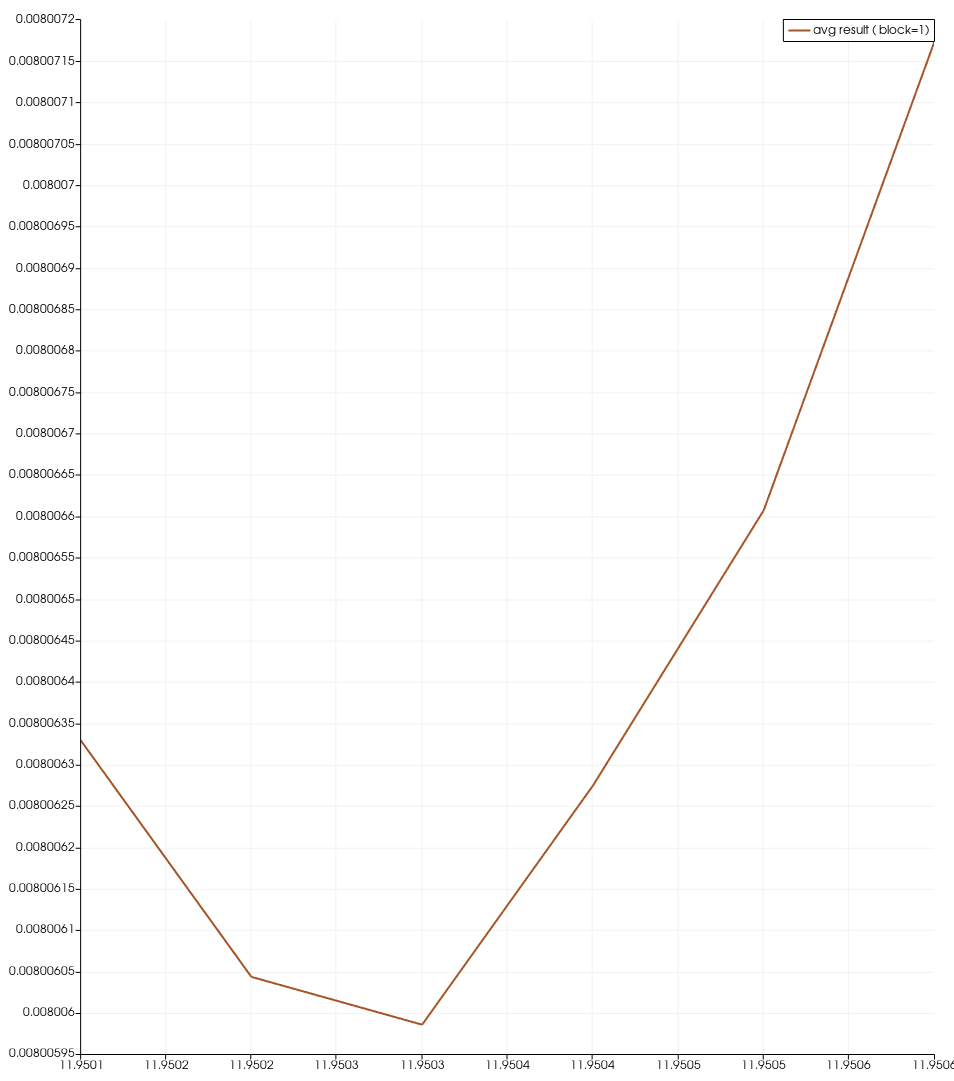
A PythonCalculator and a PlotDataOverTime is enough.
Use the following in your PythonCalculator:
`max(mag(U))`
---
### Author:  [@Pradip\_Aryal](https://discourse.paraview.org/u/Pradip_Aryal)
#### Post date: [December 2, 2021, 3:47pm UTC](https://discourse.paraview.org/t/plot-data/8486/5 "2021-12-02T15:47:50Z")
Thank you, Mathieu. It does exactly what I want.
Best regards,