# plot difference between two slices
**URL:** https://discourse.paraview.org/t/plot-difference-between-two-slices/11299
**Category:** ParaView Support
**Created:** [January 30, 2023, 8:28pm UTC](https://discourse.paraview.org/t/plot-difference-between-two-slices/11299 "2023-01-30T20:28:28Z")
**Posts on this page:** 5
**Page:** 1
### Author:  [@jludorf](https://discourse.paraview.org/u/jludorf)
#### Post date: [January 30, 2023, 8:28pm UTC](https://discourse.paraview.org/t/plot-difference-between-two-slices/11299/1 "2023-01-30T20:28:28Z")
Hi there,
I don’t have much expertise using paraView so sorry in advance if this gets trivial but I haven’t found anything useful so far.
I am trying to evaluate the outcome of a openFOAM simulation.
In this case I try to place two planes in the simulated pipe and want to plot the difference between those two on one of them (there’s an obstacle between them taking influence in the simulation), so that for any specific point the shown value is something like value.plane2 - value.plane1.

How can I achieve this?
---
### Author:  [@Kenneth\_Moreland](https://discourse.paraview.org/u/Kenneth_Moreland)
#### Post date: [January 30, 2023, 9:05pm UTC](https://discourse.paraview.org/t/plot-difference-between-two-slices/11299/2 "2023-01-30T21:05:18Z")
In the future, when you ask a question it helps a lot to post a link to your actual data. It makes it easier for us to answer your specific question.
I believe the best way to compute the difference is to use the `Resample With Dataset` filter to first combine the data of the two slices together and then use the `Calculator` to compute the difference. That said, this is complicated by the fact that the `Resample With Dataset` filter works with spatial locations, so you will have to slice once, move the slice to the location of the second slice, and then resample the original cylinder dataset. You also need to do some array renaming to keep track of the two sets of fields.
Here is the full set of instructions to achieve this.
1. Use the `Slice` filter _once_ to create one of the slices.
2. Use the `Rename Arrays` filter on the slice to rename the fields you want to take the diff of. For example, if you have a field named `field`, change its name to something like `field_plane1`.
3. Use the `Transform` filter on the renamed arrays to move the first slice to the position of the second slice. Use the `Translate` property to move the slice along the axis to the location of the second slice. For example, if the two slices you want to compare are at the _y_=1 and _y_=3 planes and the `Slice` filter is on the _y_=1 plane, then set up the `Transform` filter to `Translate` [0, 2, 0] (2 units in the positive _y_ direction).
4. Add the `Resample With Dataset` filter.
4.1 When you first create the filter, you will get a `Change Input Dialog`. Use this to set the `Source Data Arrays` input to the original cylinder dataset and the `Destination Mesh` to your `Translate`d slice.
4.2 Once you’ve set the inputs, turn on advanced properties  and turn on the `Pass Point Arrays` option. This will make available the data from both the cylinder and the first slice (which is now translated as the second slice).
5. Use the `Calculator` filter to compute the difference between the field values of the two slices.
Here is an example state file that computes the difference between two slices on the `disk_out_ref.ex2` example file that comes with ParaView (in the Examples directory). This data is also a cylinder (except it is oriented along the _z_ axes whereas it looks like yours is oriented along the _y_ axis).
[diff-slices.pvsm](https://discourse.paraview.org/uploads/short-url/yWNsuPRM8CTSHK95hTv1ahPPKqu.pvsm) (838.8 KB)
---
### Author:  [@jludorf](https://discourse.paraview.org/u/jludorf)
#### Post date: [January 31, 2023, 5:27pm UTC](https://discourse.paraview.org/t/plot-difference-between-two-slices/11299/3 "2023-01-31T17:27:33Z")
Yes, that’s it! Thank you so much!!!
To take it one step further:
If I wanted to compare the same place in two different simulations (e.g. the same geometry but different speed for the liquid), could I also recycle this route? I guess “Transform” wouldn’t be necessary, “Rename Arrays” would be very important to be able to keep the data apart and in “Source Data Arrays” I would have to make a call for the second simulation?
Also I am not sure how I could share the simulation? I can of course attach the .pvsm file but doesn’t it link to the original simulation? Which could take hundreds of GB if I wanted to upload that as well.
---
### Author:  [@Kenneth\_Moreland](https://discourse.paraview.org/u/Kenneth_Moreland)
#### Post date: [January 31, 2023, 8:20pm UTC](https://discourse.paraview.org/t/plot-difference-between-two-slices/11299/4 "2023-01-31T20:20:23Z")
Yes, you got it. The `Resample With Dataset` can be used to combine fields from two overlapping volumes as well.
This FAQ has some information about posting files: [I want to share data here, how can I do that ?](https://discourse.paraview.org/t/i-want-to-share-data-here-how-can-i-do-that/5296) For practical considerations, it is sometimes necessary to subset your data that represents what you are trying to do.
---
### Author:  [@zj519](https://discourse.paraview.org/u/zj519)
#### Post date: [January 22, 2024, 4:33pm UTC](https://discourse.paraview.org/t/plot-difference-between-two-slices/11299/5 "2024-01-22T16:33:02Z")
Hi Kenneth,
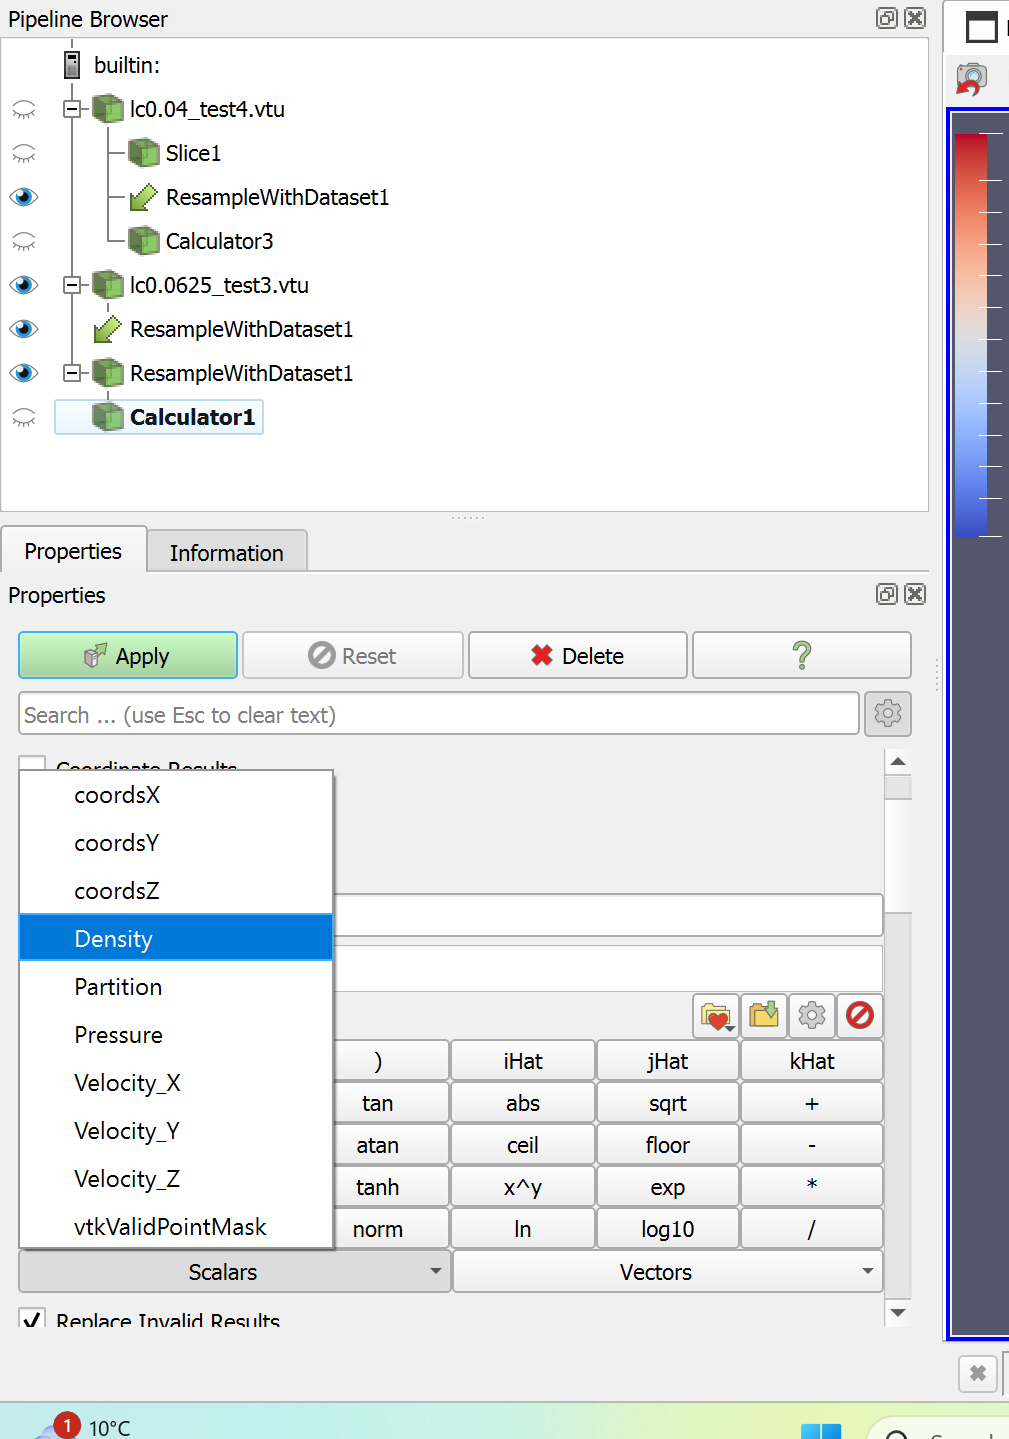
I have two vtu datasets, and I have used “resample with dataset” to make the two files have the same number of cells and points. Following point 4 of your instruction, I have turned on the pass point array option. However, when I try to do MSE of density between the two vtu files using calculator, I still can only see one density as shown on the screenshot below. How can I access density of both files and compute MSE please?