# Plot field against blade length
**URL:** https://discourse.paraview.org/t/plot-field-against-blade-length/9244
**Category:** ParaView Support
**Tags:** python, vtk
**Created:** [March 21, 2022, 8:41pm UTC](https://discourse.paraview.org/t/plot-field-against-blade-length/9244 "2022-03-21T20:41:12Z")
**Posts on this page:** 5
**Page:** 1
### Author:  [@Qutadah\_Rababah](https://discourse.paraview.org/u/Qutadah_Rababah)
#### Post date: [March 21, 2022, 8:41pm UTC](https://discourse.paraview.org/t/plot-field-against-blade-length/9244/1 "2022-03-21T20:41:12Z")
Hello everyone, I have plotted a field on blades of a pump in a my simulations. Th problem is, I get the plot against the region Id, however I would like to have a plot against the blade length on the x-axis, where the the first end of the blade is 0 mm and the end of the blade is its length in mm.
Can anyone advise how to do this?
I have attached necessary files.
Thanks.
[blade1-sliced-plots.pvsm](https://discourse.paraview.org/uploads/short-url/n48V68IATfKMB6rbFX1u5hqeHPd.pvsm) (733.2 KB)
> **[BLADE\_WALL\_ROT](https://onedrive.live.com/redir?resid=A94F32DC70462C88%2171444&authkey=%21AETtUUE5t469OrU&e=8HeOS8)**
>
> Folder
---
### Author:  [@utkarsh.ayachit](https://discourse.paraview.org/u/utkarsh.ayachit)
#### Post date: [March 21, 2022, 11:04pm UTC](https://discourse.paraview.org/t/plot-field-against-blade-length/9244/2 "2022-03-21T23:04:06Z")
I think **Plot On Sorted Lines** should do the trick. Use `arc_length` for x-axis – which is default after the filter has been applied.

---
### Author:  [@Qutadah\_Rababah](https://discourse.paraview.org/u/Qutadah_Rababah)
#### Post date: [March 22, 2022, 11:54am UTC](https://discourse.paraview.org/t/plot-field-against-blade-length/9244/3 "2022-03-22T11:54:39Z")
Ok great, that did the trick, another question would be now how do I know which side of the blade is the one on the plot? Are the variables added along the arc\_length for both sides? How do I differentiate them and plot them seperately?
Thanks!
---
### Author:  [@utkarsh.ayachit](https://discourse.paraview.org/u/utkarsh.ayachit)
#### Post date: [March 22, 2022, 11:57am UTC](https://discourse.paraview.org/t/plot-field-against-blade-length/9244/4 "2022-03-22T11:57:41Z")
The output from `Plot on Sorted Lines` can be shown in the 3D view too. Then, try coloring it with arc\_length and you should know which end is which. The arc\_length starts from 1 end and continues till the other end.
---
### Author:  [@Qutadah\_Rababah](https://discourse.paraview.org/u/Qutadah_Rababah)
#### Post date: [March 22, 2022, 12:09pm UTC](https://discourse.paraview.org/t/plot-field-against-blade-length/9244/5 "2022-03-22T12:09:58Z")
Great it worked!!
Thanks a lot!
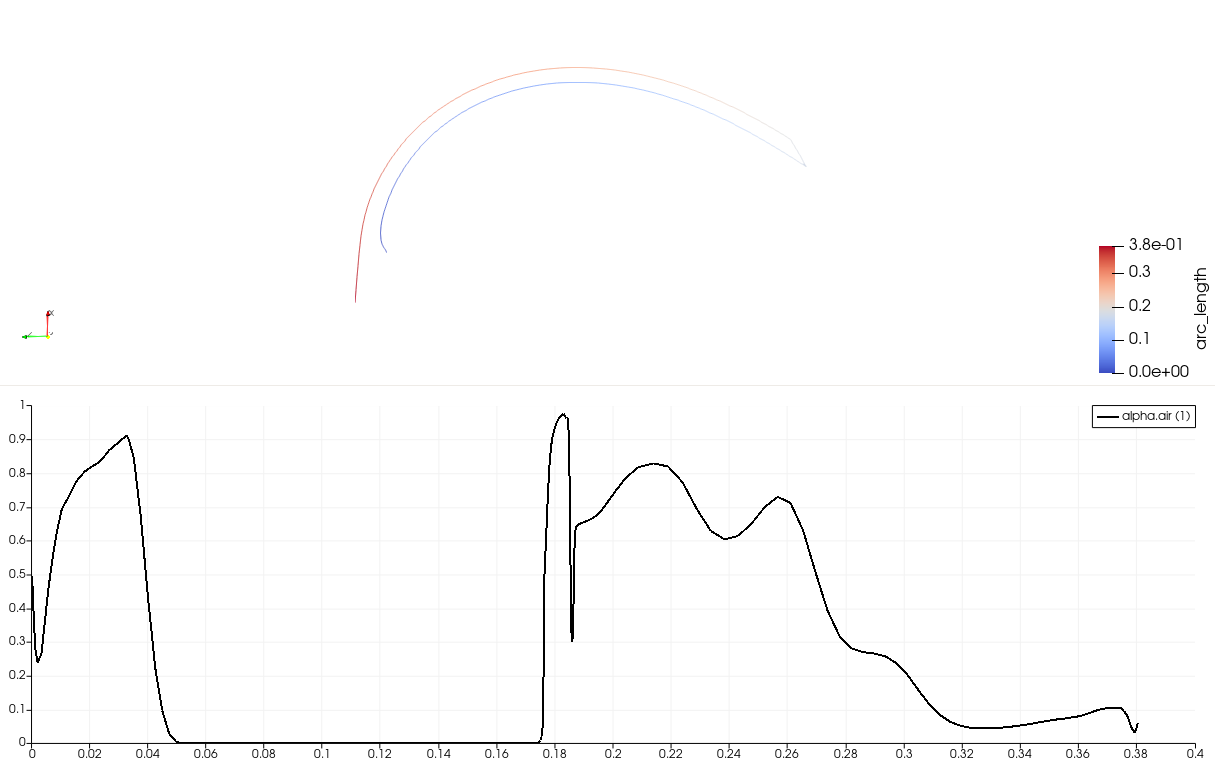
Best regards,
Qutadah