# Plot on Intersection Curves yields incorrect line plot
**URL:** https://discourse.paraview.org/t/plot-on-intersection-curves-yields-incorrect-line-plot/8471
**Category:** Development
**Tags:** vtk
**Created:** [November 23, 2021, 10:33pm UTC](https://discourse.paraview.org/t/plot-on-intersection-curves-yields-incorrect-line-plot/8471 "2021-11-23T22:33:10Z")
**Posts on this page:** 2
**Page:** 1
### Author:  [@gnikit](https://discourse.paraview.org/u/gnikit)
#### Post date: [November 23, 2021, 10:33pm UTC](https://discourse.paraview.org/t/plot-on-intersection-curves-yields-incorrect-line-plot/8471/1 "2021-11-23T22:33:10Z")
I am trying to get the line plot of the intersection of spherical shell with a plane along the z-axis using a `PlotOnIntersectionCurves` filter but the resulting line chart is vastly different from when the data are extracted and plotted with some other external tool e.g. Python and matplotlib.
Am I do something wrong/missing something obvious in ParaView?
## Steps to replicate
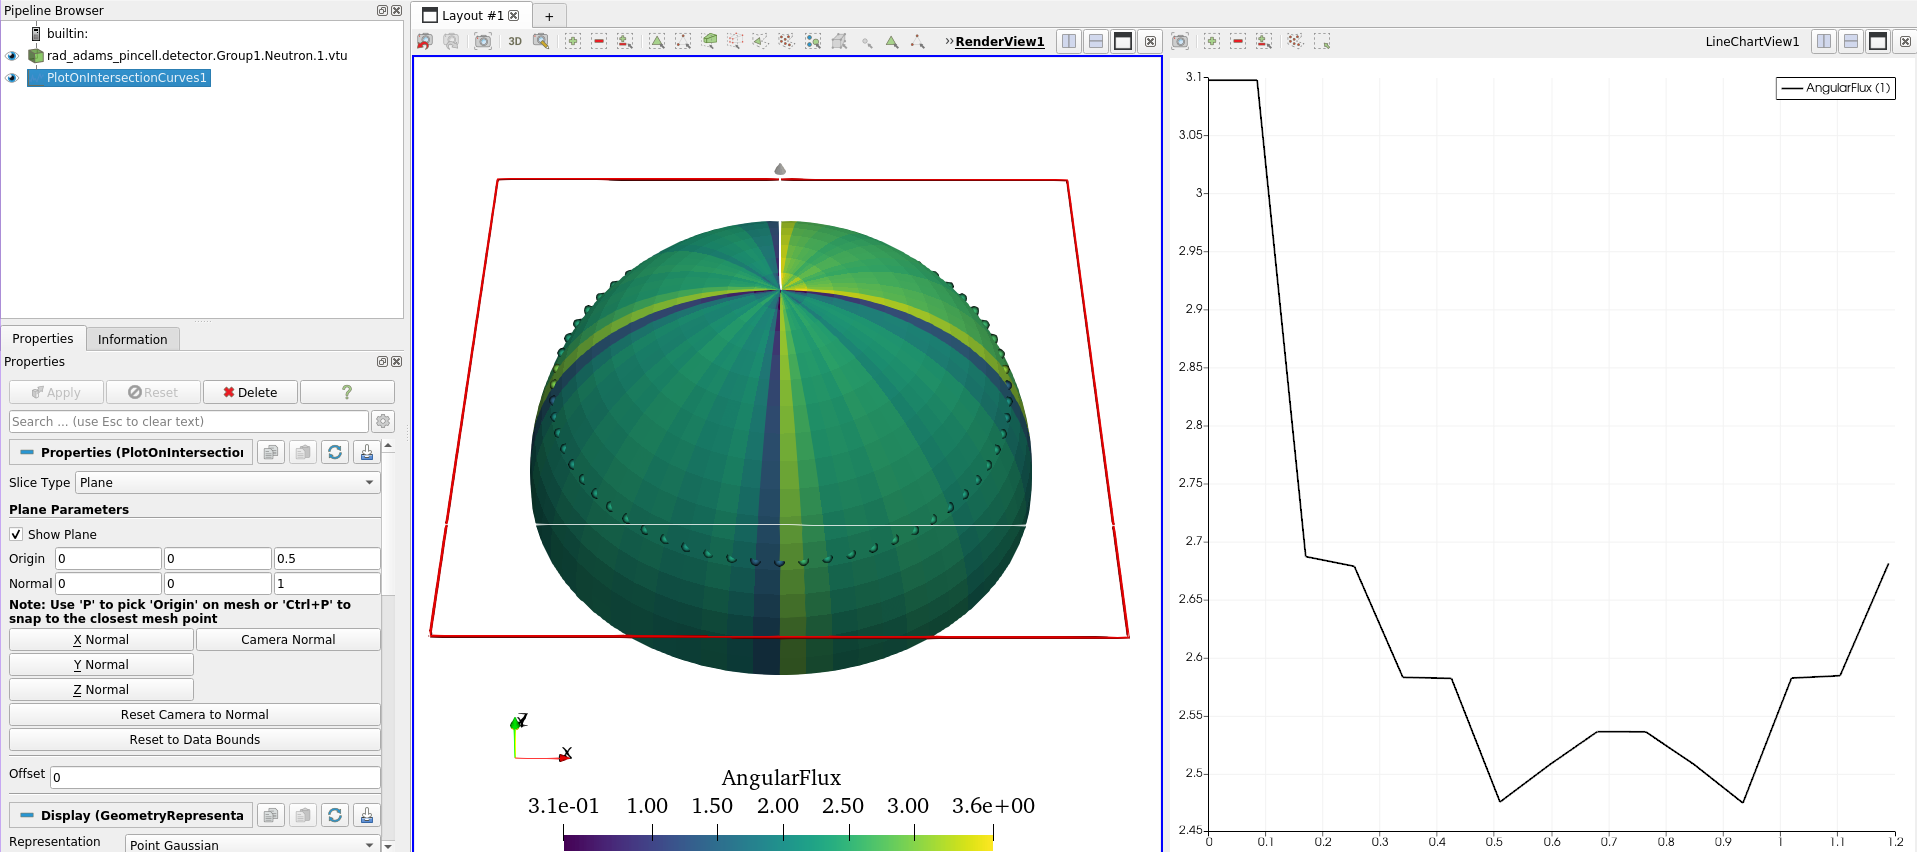
1. `Filters > Plot on Intersection Curves`
2. Set `Plane Parameters` for intersection curve to:
Origin: 0, 0, 0.5
Normal: 0, 0, 1
## Paraview output
## Actual result
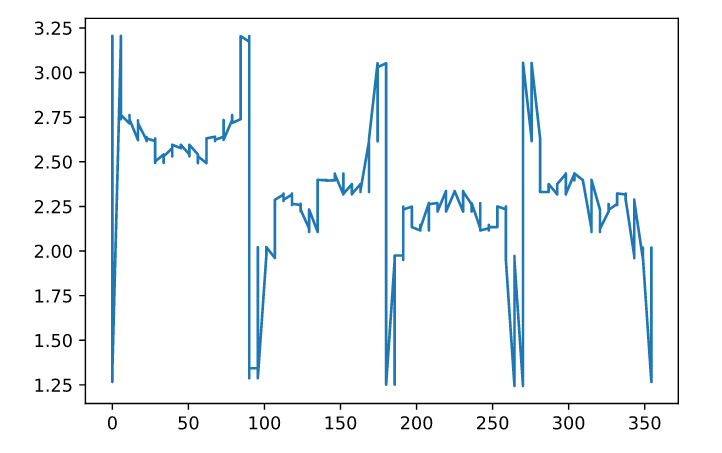
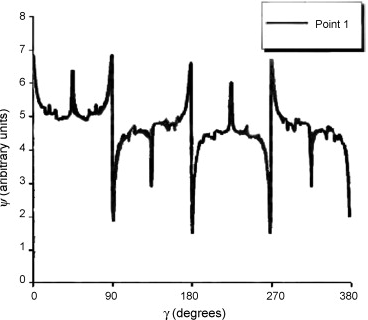
The result albeit oscillatory agrees with the “true” solution for our problem
## Files
[rad\_adams\_pincell.detector.Group1.Neutron.1.vtu](https://discourse.paraview.org/uploads/short-url/ajEkaT3ha35AlHiYvKI92vsg4w4.vtu) (49.5 KB)
## Additional info
Paraview 5.10.0-RC1
---
### Author:  [@Kenichiro-Yoshimi](https://discourse.paraview.org/u/Kenichiro-Yoshimi)
#### Post date: [November 24, 2021, 12:55am UTC](https://discourse.paraview.org/t/plot-on-intersection-curves-yields-incorrect-line-plot/8471/2 "2021-11-24T00:55:37Z")
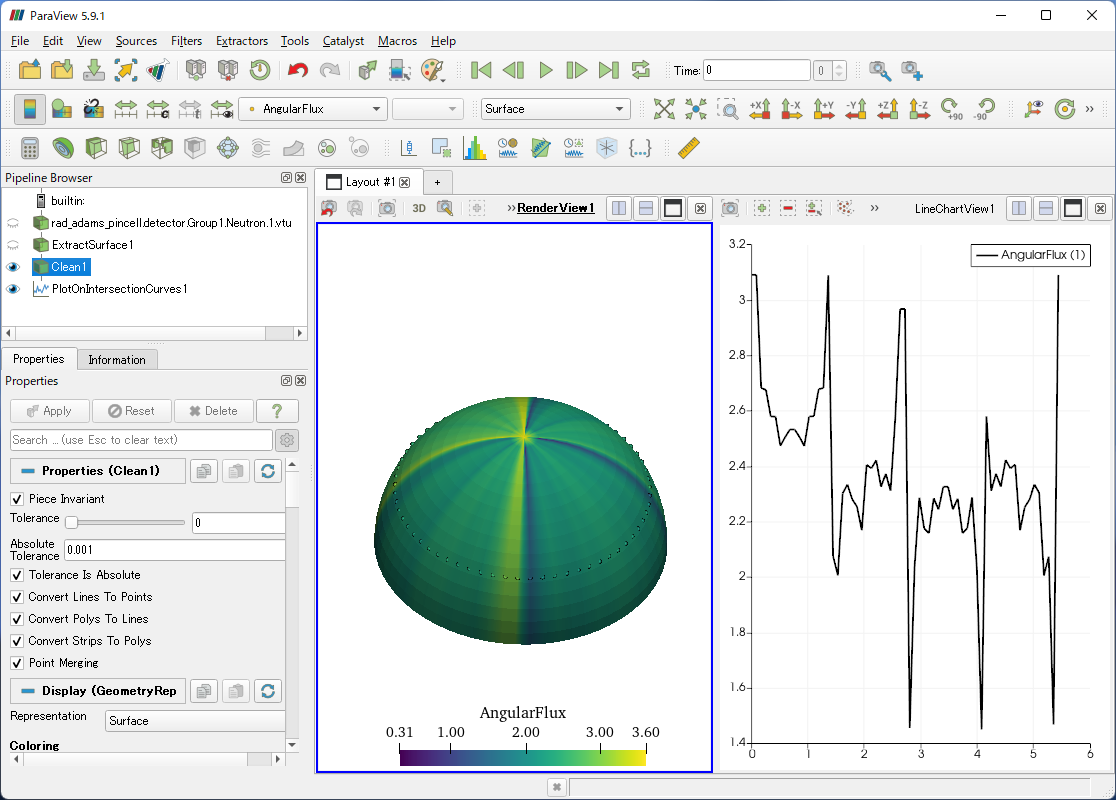
Since your data contains a lot of duplicate points, you need to remove them first. Therefore, before applying the **Plot On Intersection Curves** filter, use the **Extract Surface** filter to convert it to vtkPolyData, and then run the **Clean filter** with the following options:
- **Tolerance Is Absolute** : On
- **Absolute Tolerance** : 0.001
The result will look something like this.