# Plot over a Contour Line
**URL:** https://discourse.paraview.org/t/plot-over-a-contour-line/7531
**Category:** ParaView Support
**Created:** [July 1, 2021, 9:23am UTC](https://discourse.paraview.org/t/plot-over-a-contour-line/7531 "2021-07-01T09:23:19Z")
**Posts on this page:** 2
**Page:** 1
### Author:  [@garciahahn](https://discourse.paraview.org/u/garciahahn)
#### Post date: [July 1, 2021, 9:23am UTC](https://discourse.paraview.org/t/plot-over-a-contour-line/7531/1 "2021-07-01T09:23:20Z")
Hi to the community!
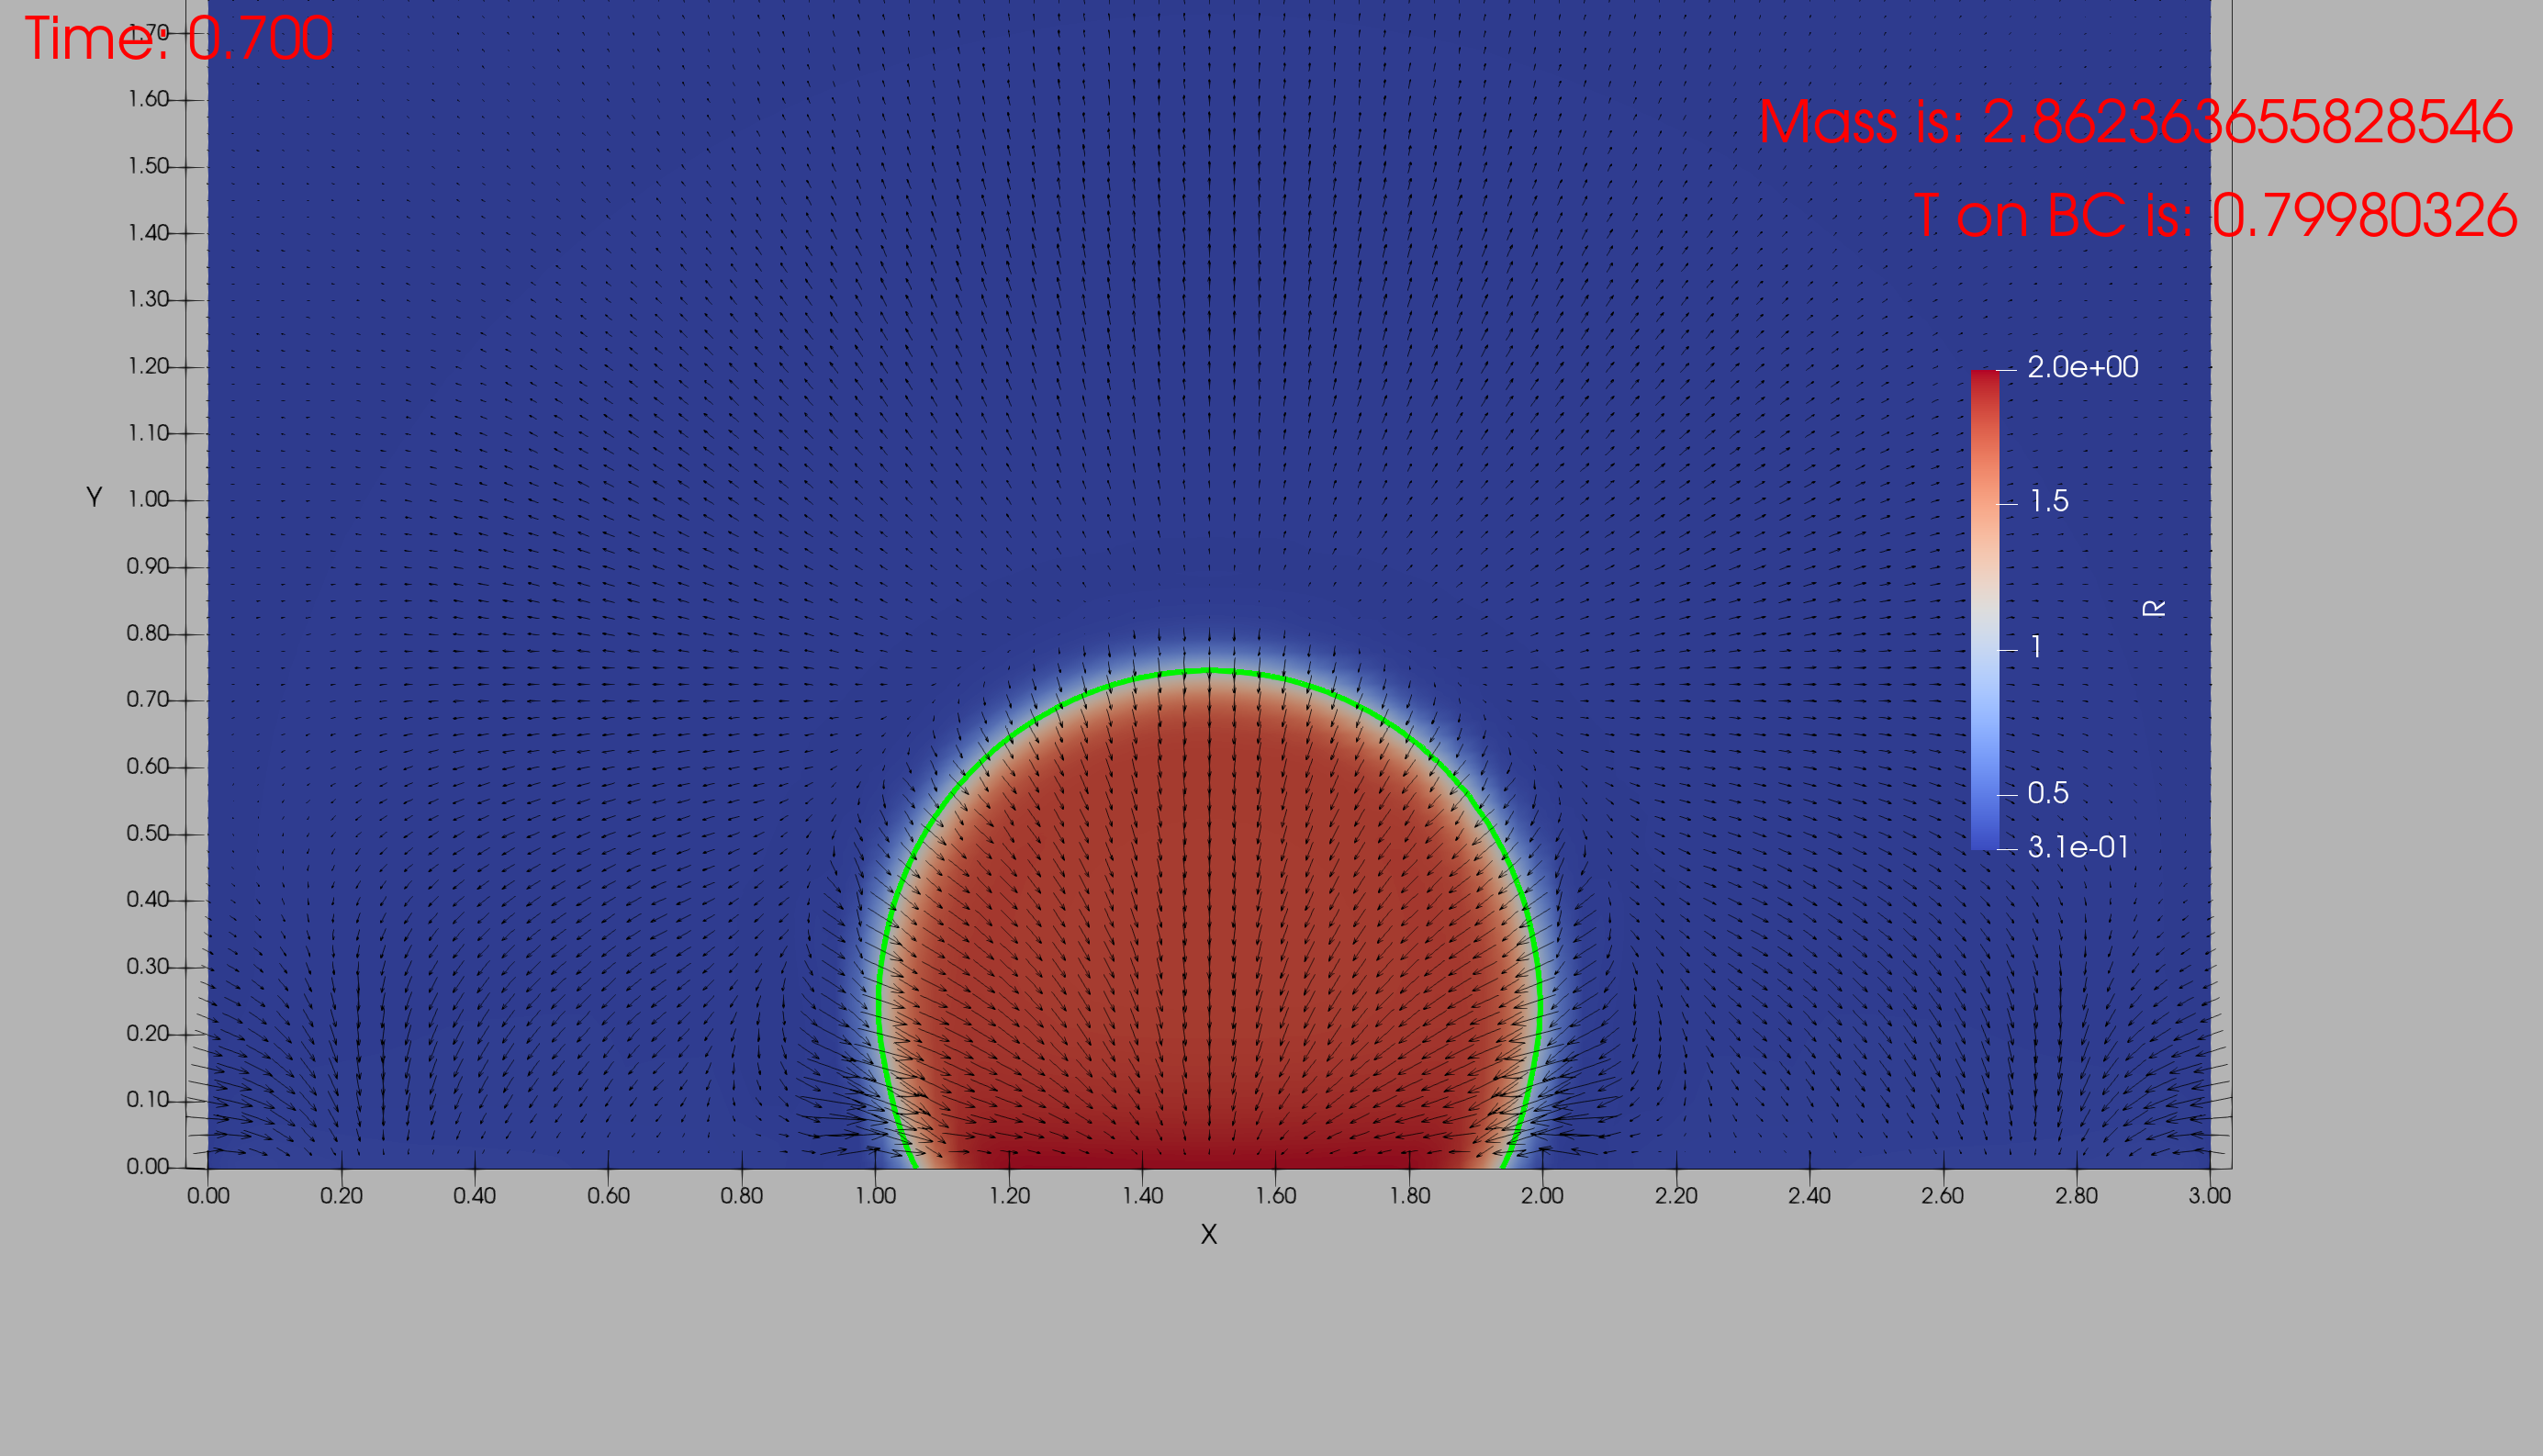
I am doing some research in droplets and I am using phase field methods to solve some droplets in a domain. To visualize I am using ParaView looking into the different fields of the system. My droplets are defined by the density field and the “interface” I set is located at a constant value of my density. To be able to visualize such an interface I use a contour filter. That draws a line as the one I am showing in the image attached to this post (green line). Over the time (on each time step) this contour is changing position (due to the droplet changing in shape).
I would like to be able to plot quantities over that contour. I know that that contour is, so far, a bunch of points that happen to be next to each other and, in order to plot, I would have to have a curve that follows this contour (just theorizing here).
I don’t even know where to start looking. Even though I had used ParaView before, it was only to a certain extent, so perhaps there are many things I should be able to do that I have not realized.
Thank you all in advance!
Julián
---
### Author:  [@Kenichiro-Yoshimi](https://discourse.paraview.org/u/Kenichiro-Yoshimi)
#### Post date: [July 4, 2021, 12:52am UTC](https://discourse.paraview.org/t/plot-over-a-contour-line/7531/2 "2021-07-04T00:52:57Z")
Hello,
I tried a similar operation for plotting around the wing, which may be helpful here.
> [@Surface plot or polyline plot](https://discourse.paraview.org/t/surface-plot-or-polyline-plot/7485):
>
> [Paraview\_Help.vtk](https://discourse.paraview.org/uploads/short-url/ytgDxmf36ilKMpuAdT7ifBsggqt.vtk) (1.9 MB) Hi Community, There has to be a way to visualize the surface Mach plot or Cp plot from a 2D simulation. I cannot figure out the feature set where I can either extract the data from a polyline or the feature to look at the surface profile on the wing. Attached is the vtk file for our perusal. -SD