# Plot over a curved cross section
**URL:** https://discourse.paraview.org/t/plot-over-a-curved-cross-section/14225
**Category:** ParaView Support
**Tags:** vtk
**Created:** [March 21, 2024, 6:00pm UTC](https://discourse.paraview.org/t/plot-over-a-curved-cross-section/14225 "2024-03-21T18:00:57Z")
**Posts on this page:** 5
**Page:** 1
### Author:  [@Daluar](https://discourse.paraview.org/u/Daluar)
#### Post date: [March 21, 2024, 6:00pm UTC](https://discourse.paraview.org/t/plot-over-a-curved-cross-section/14225/1 "2024-03-21T18:00:57Z")
Hello everyone,
I am trying to make line plots of the pressure distribution on a specific cross-section of an aircraft wing using ParaView. I’ve exported my raw data into VTK format, and the data represents the pressure values over the wing surface. I am facing difficulties in plotting it properly. I tried two different approaches:
(a) Simply taking a slice and using the “Plot Data” filter.
(b) Importing the points coordinates, creating a polyline, applying a programmable filter, slicing along the polyline, and then plotting on the curve intersection.
Unfortunately, neither of these methods has worked for me. As I am new to ParaView, I am seeking valuable suggestions on how to plot this type of case properly. I have attached my coordinates at a certain section on the wing, VTM and VTS files for your reference.
Your assistance would be greatly appreciated.
Thank you.
[crmG0\_23M\_n0547099\_t4.300e+02\_BCWall.zip](https://discourse.paraview.org/uploads/short-url/glUlUbZSctMm5e6c0WTCqCrvEJW.zip) (2.1 MB)
[crmG0\_23M\_n0547099\_t4.300e+02\_BCWall.walldata](https://discourse.paraview.org/uploads/short-url/bn6x5lmTpET3JUFTiLTvDSkDniN.walldata) (1.4 MB)
[coordSecA.txt](https://discourse.paraview.org/uploads/short-url/dBX3tA3ksoP6CW8uwItCXREYx8V.txt) (9.3 KB)
---
### Author:  [@Daluar](https://discourse.paraview.org/u/Daluar)
#### Post date: [March 24, 2024, 12:30am UTC](https://discourse.paraview.org/t/plot-over-a-curved-cross-section/14225/2 "2024-03-24T00:30:12Z")
could anyone please help?
---
### Author:  [@mwestphal](https://discourse.paraview.org/u/mwestphal)
#### Post date: [March 25, 2024, 8:42am UTC](https://discourse.paraview.org/t/plot-over-a-curved-cross-section/14225/3 "2024-03-25T08:42:58Z")
Please keep in mind people usually dont look at this discourse during the weekend.
---
### Author:  [@Kenichiro-Yoshimi](https://discourse.paraview.org/u/Kenichiro-Yoshimi)
#### Post date: [March 25, 2024, 10:43am UTC](https://discourse.paraview.org/t/plot-over-a-curved-cross-section/14225/4 "2024-03-25T10:43:05Z")
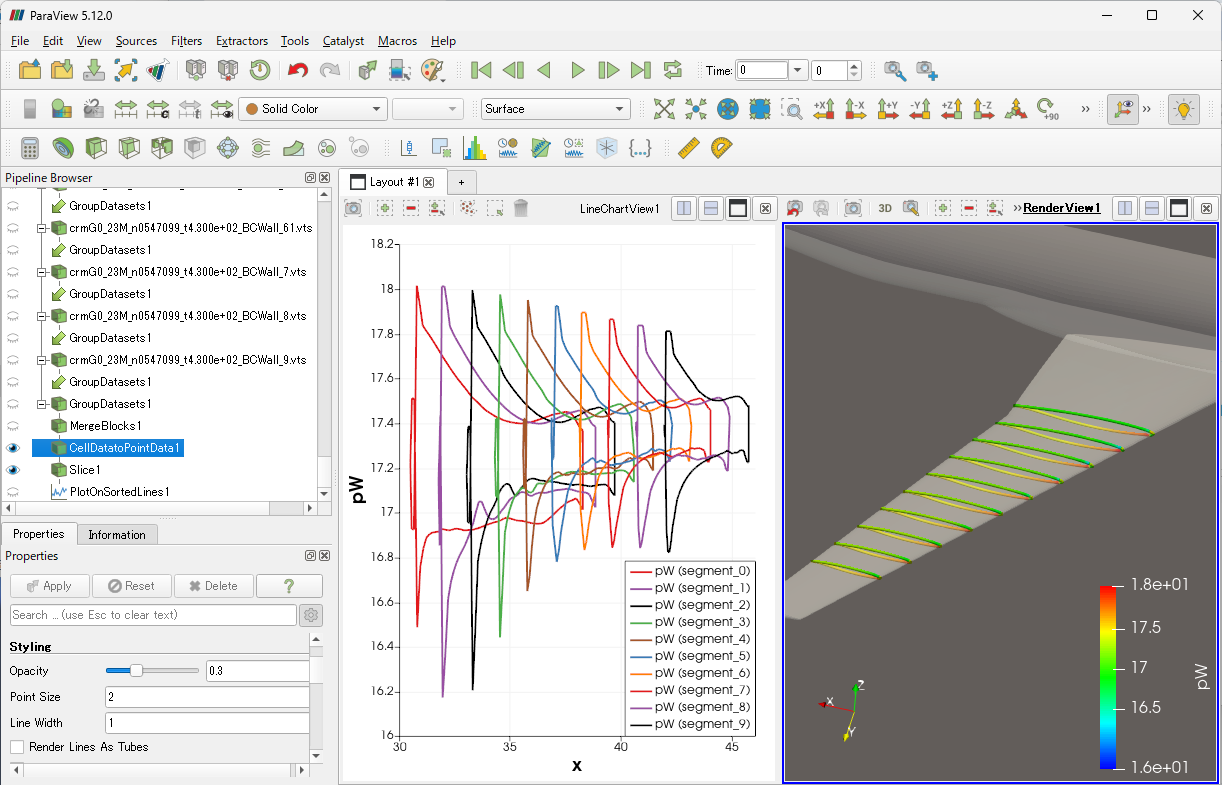
The following is a brief description of how to plot wing sections.
1. Load all vts files.
2. On the `Pipelilne Browser`, select all vts files and merge them into one with the `Group Datasets` filter.
3. Merge them into one unstructured grid using the `Merge Blocks` filter.
4. Convert the analysis result array to point data with `Cell Data To Point Data` filter.
5. Slice the wing surface with the `Slice` filter.
6. Plot the graph with `Plot On Sorted Lines` filter.
State file is attached for your reference. I hope it helps you.
[slice\_wing.pvsm](https://discourse.paraview.org/uploads/short-url/9OTD32iPaJVudWeJGrVlG06vY2X.pvsm) (870.0 KB)
---
### Author:  [@Daluar](https://discourse.paraview.org/u/Daluar)
#### Post date: [March 25, 2024, 2:42pm UTC](https://discourse.paraview.org/t/plot-over-a-curved-cross-section/14225/5 "2024-03-25T14:42:26Z")
@Kyoshimi Thank you very much for your response. It will surely help me a lot. Thank you so much.