# Plot over line does not show the chart
**URL:** https://discourse.paraview.org/t/plot-over-line-does-not-show-the-chart/10250
**Category:** In Situ Support
**Created:** [September 4, 2022, 3:04pm UTC](https://discourse.paraview.org/t/plot-over-line-does-not-show-the-chart/10250 "2022-09-04T15:04:37Z")
**Posts on this page:** 9
**Page:** 1
### Author:  [@Jonas](https://discourse.paraview.org/u/Jonas)
#### Post date: [September 4, 2022, 3:04pm UTC](https://discourse.paraview.org/t/plot-over-line-does-not-show-the-chart/10250/1 "2022-09-04T15:04:37Z")
Uploading: pastyrkageos\_t0002.vtu…
Hi,
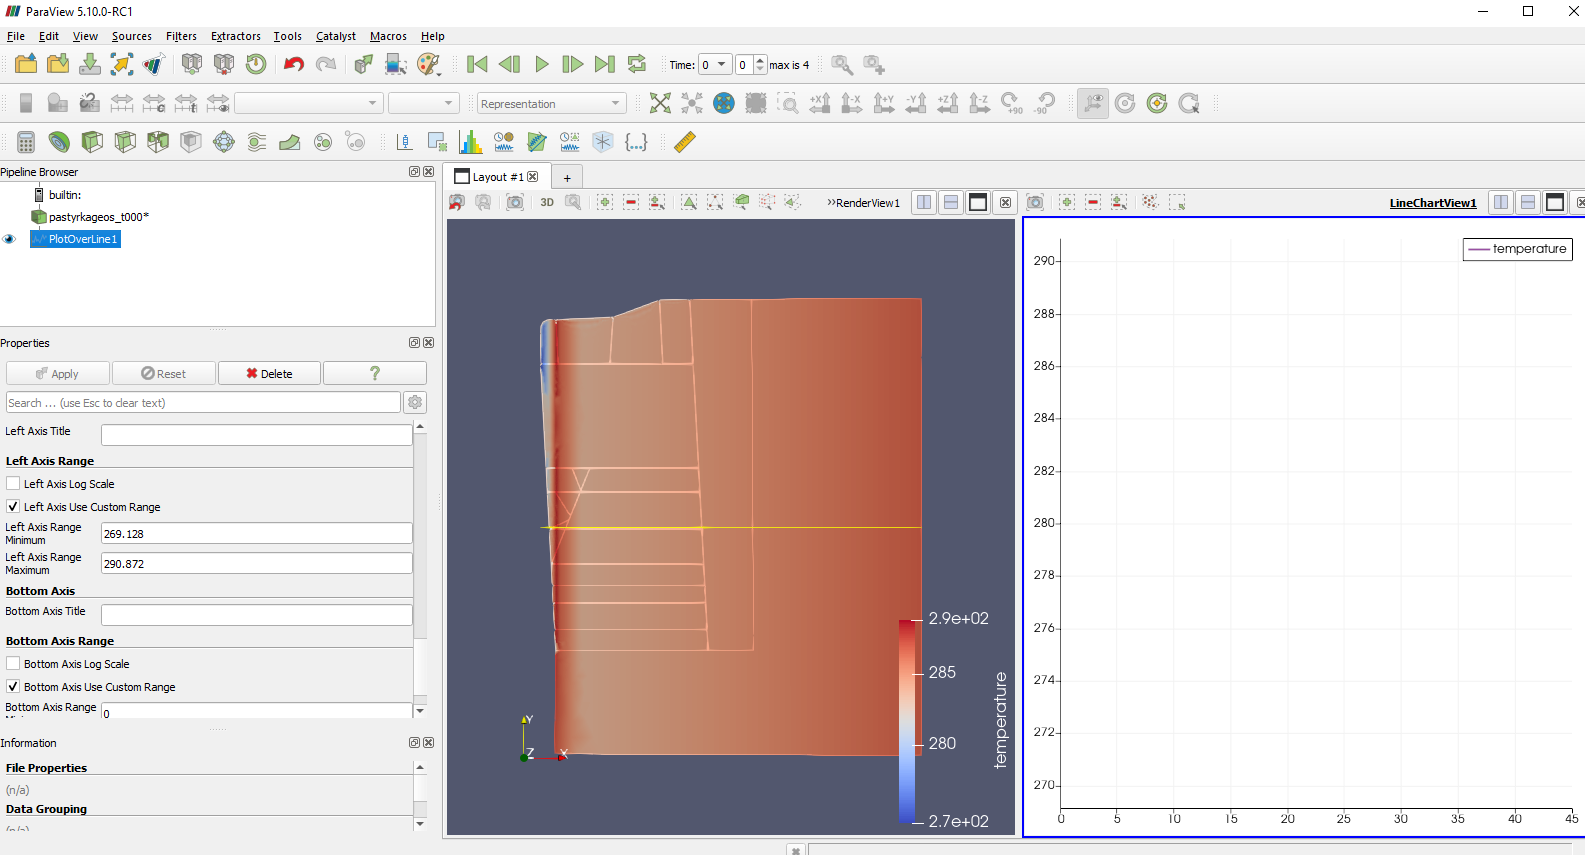
I am having problem with vtu file. When i want to plot temperature values over the line, the chart window opens, but does not show any data. Does anybody knows what coud be causing the problem?
Thank you for your answers,
Jonas
---
### Author:  [@mwestphal](https://discourse.paraview.org/u/mwestphal)
#### Post date: [September 5, 2022, 2:47am UTC](https://discourse.paraview.org/t/plot-over-line-does-not-show-the-chart/10250/2 "2022-09-05T02:47:57Z")
Is your input dataset 2D ? If that so you will need to ensure the dataset and line are on the same plane.
---
### Author:  [@Jonas](https://discourse.paraview.org/u/Jonas)
#### Post date: [September 5, 2022, 7:08am UTC](https://discourse.paraview.org/t/plot-over-line-does-not-show-the-chart/10250/3 "2022-09-05T07:08:01Z")
Yes, It is 2D dataset. For some reason it is not on z=0 plane as the original mesh, but it looks like paraview sets the plotting line on the right plane, so it should work fine. Unfortunately there is error during uploading the VTU file here, so its only on google drive
> **[pastyrkageos\_t0001.vtu](https://drive.google.com/file/d/1mzusG9Zj2L4OfkIPeltL76tOebkEGe66/view?usp=sharing)**
>
> Google Drive file.
---
### Author:  [@mwestphal](https://discourse.paraview.org/u/mwestphal)
#### Post date: [September 5, 2022, 7:11am UTC](https://discourse.paraview.org/t/plot-over-line-does-not-show-the-chart/10250/4 "2022-09-05T07:11:48Z")
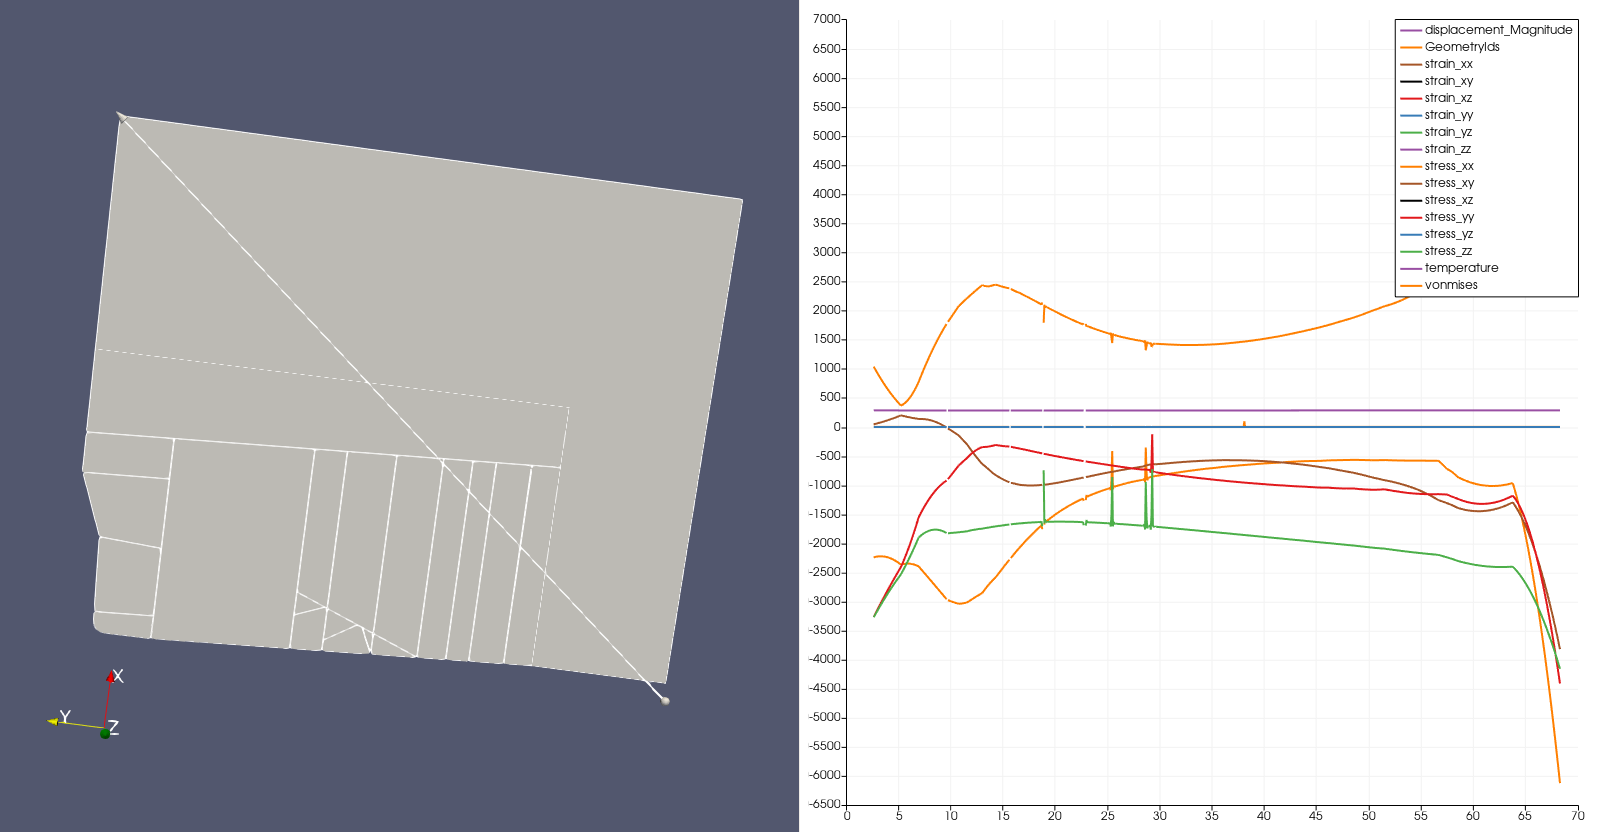
Looks like this is working well with ParaView 5.10.1
---
### Author:  [@Jonas](https://discourse.paraview.org/u/Jonas)
#### Post date: [September 5, 2022, 8:43am UTC](https://discourse.paraview.org/t/plot-over-line-does-not-show-the-chart/10250/5 "2022-09-05T08:43:47Z")
Reinstallation helped. Is there a way to align the dataset to xy plane to avoid further confusions?
Thanks a lot
---
### Author:  [@mwestphal](https://discourse.paraview.org/u/mwestphal)
#### Post date: [September 5, 2022, 10:58am UTC](https://discourse.paraview.org/t/plot-over-line-does-not-show-the-chart/10250/6 "2022-09-05T10:58:21Z")
Yes, you can use the calculator and force the Z coordinates to zero.
---
### Author:  [@Jonas](https://discourse.paraview.org/u/Jonas)
#### Post date: [September 9, 2022, 6:22am UTC](https://discourse.paraview.org/t/plot-over-line-does-not-show-the-chart/10250/7 "2022-09-09T06:22:32Z")
Could you please elaborate this? I am new to paraview and I am struggling with the calculator filter.
Thank you
---
### Author:  [@mwestphal](https://discourse.paraview.org/u/mwestphal)
#### Post date: [September 9, 2022, 6:36am UTC](https://discourse.paraview.org/t/plot-over-line-does-not-show-the-chart/10250/8 "2022-09-09T06:36:34Z")
Hi @Jonas
Here are exact steps:
- Run ParaView
- Open your dataset, Apply
- Filters → Alphabetical → Calculator
- `coordsX*iHat+coordsY*jHat+0*kHat`
- Check the "Coordinates Results` checkbox
- Apply
---
### Author:  [@Jonas](https://discourse.paraview.org/u/Jonas)
#### Post date: [September 9, 2022, 7:20am UTC](https://discourse.paraview.org/t/plot-over-line-does-not-show-the-chart/10250/9 "2022-09-09T07:20:45Z")
It works perfect,
Thank you